Can a data centric process lead to superior stock selection ? By Axis AMC

The importance of data
Market participants cannot emphasize enough on the importance of evaluating business prospects of the company over the near future. The outlook of the firm and its repercussion on financial statements helps influence stock prices and the multiples at which it trades, relative to its sector and broader markets. While all market participants have their own methods and means to evaluate this, sell side analysts as a community play a key role in anchoring market expectations. Analysts express their views on the stock mainly through firms’ estimated earnings over near time horizon and recommendations i.e. Buy, Hold etc. In this article we will look at the former and evaluate the efficacy of the same.
Academic research across the world and anecdotal experience in our own markets have demonstrated that the analysts’ optimism on earnings expectations are normally revised during the course of the year. However, despite this bias, we want to showcase how the analyst community serves as a reliable guiding post to influence the opinion of other participants as is reflected through subsequent stock price behaviour.
The practical use of data
Example 1: For the 5-year period ending 31st Dec 2021, Nifty Auto index rose by 3.65% on an annualized basis, while Nifty rose by 16.22%, resulting in an annual underperformance of 12.60%. If one was following the fundamentals of the business during this period, then the underperformance wouldn’t be so surprising. For instance, in the below chart we have plotted expected mean earnings per share over the next 12 months’ v/s Price movement of the largest passenger car company in our markets and have indexed them both to 100 at the beginning of 2014.
Both, price and Earnings expectations peaked end of 2017 and since then have only headed south. While this can be attributed to many fundamentals aspects including delayed model refresh cycle, lack of SUV’s & phasing out of diesel portfolio, the larger takeaway is the value that earnings expectations data brings to the table.
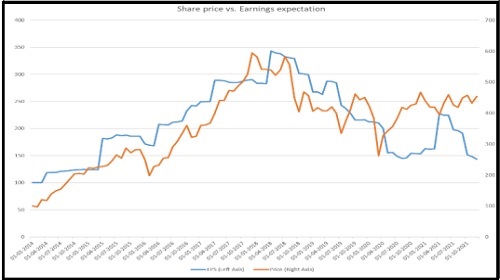
Example 2: The below example is for a leading 2-wheeler company. While in this case the stock price peaks a bit before expected earnings, it is still a good lead indicator of the overall direction and variability in price.

The fundamentals driving earnings variability include price inflation thanks to tightening emission norms, resulting in stretched affordability, especially at the entry level. However, the crux is the predictive power of the data series.
Conclusion
This exercise can be repeated for stocks across sectors and for the most part the results are quite consistent with high correlation between stock price movement and changes in earnings expectations. As an extension, it is also seen that stocks with frequent and large revision in expected earnings i.e. high expected earnings volatility also subsequently experience volatile stock price behaviour. So, this data can not only be used from a return perspective, but also for risk mitigation purposes. Further, when this data is aggregated at a sector level or at a market level the resulting broader trends may assist in making sector & asset allocation decisions.
To Read Complete Report & Disclaimer Click Here
Above views are of the author and not of the website kindly read disclaimer