Buoyant Economic Data and Higher UST Yields Augur Well For Dollar Index - HDFC Securities

Follow us Now on Telegram ! Get daily 10 - 12 important updates on Business, Finance and Investment. Join our Telegram Channel
Buoyant Economic Data and Higher UST Yields Augur Well For Dollar Index- HDFC Securities
Last week, Rupee took a break after three week’s gain. It closed at 71.52 a dollar with no change from previous week level. The momentum in rupee remained on positive side following month end dollar inflows and rebound in risk sentiments. Rupee recouped start of the week losses as domestic equities rallied on Friday. However, growth worries remain intact as Covid-19 cases in the India and other developing nations are rising again, reversing months of progress thanks to loosened restrictions which could make safe haven dollar dearer
This week will be holiday truncated and have only two trading session. Rupee expected to trade sideways to bullish as financial year end adjustment has been done. The focus now will be shifted to economic data and spread of virus infection. Technically, spot USDINR is having support at 72.26 and resistance at 72.85 with negative bias.
Fund Flow Activities: So far this month, overseas investors bought worth $3.07 billion equities and while sold $1.19billion debt. Through, Initial public offering and additional offering investors (Domestic + Foreign) bought $2.96 billion this month, as per Bloomberg data.
Indian Forex Reserves: Country’s forex kitty rose $233 million to $582.271 billion in the week to March 19, the Reserve Bank of India (RBI) said on Friday.
There are a few inputs which on paper look to carry dollar higher this week against major trading currencies. The encouraging US macro data and Joe Biden’s launch of his $3trn infrastructure plan bode well for American dollar along with cut in dollar short positions.
CFTC Update: The most notable flow was selling of 14k yen futures and short covering in dollar. Traders also sold sterling (6.8k), CAD (5.2k), CHF (1.8k), AUD (1.7k) and NZD (1.3k). They did, however, buy a little euro (3.3k). All in, the aggregate dollar short fell by some $2.6 billion to $9.9 billion
Federal Reserve Balance-sheet: US Reserve Bank Credit (the sum total of interest-bearing assets at the Fed) rose $49 billion from a week ago to mark a fresh high-water mark at $7.69 trillion.
Technical Observations:
USDINR
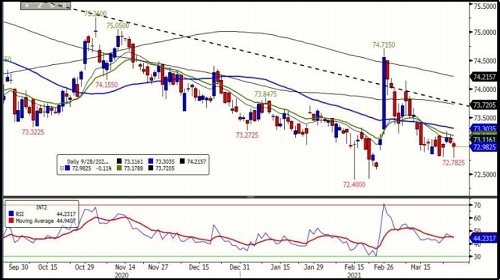
USDINR April futures formed hanging man candlestick on Friday which could act as reversal. The level to watch for reversal will be above 73.08 or below 72.78
The pair is struggling to cross the short term moving average of 20 days. Also, the lower top lower bottom formation on daily and weekly chart indicating continuation of down trend
Momentum oscillator, RSI of 14 days period hovering below 50 level and weaken in three days suggesting negative momentum.
We remain bearish in USDINR April futures until it closes above 73.30 level while on downside we see level of 72.40.
EURINR
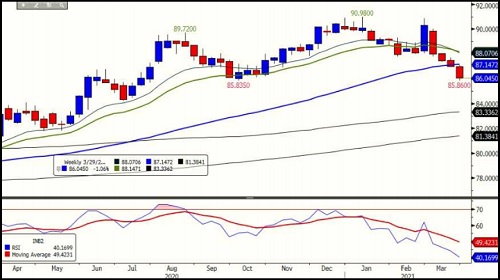
EURINR April Futures below 50 weeks moving average while held the September low of 85.835. The short term moving average is placed below medium term moving averages on daily chart.
The pair has next crucial support at 85.55, low of September month on continues chart. Breaking of the said level could open further downside and it may touch level of 83.33, the 100 week moving average.
Momentum oscillator, RSI heading southwards on daily and weekly chart.
We continue to remain bearish EURINR April futures and expecting level of 83.50 odd level on breach of 85.80 level. The near term resistance will shift to 87.15, the 50 weeks moving average.
GBPINR
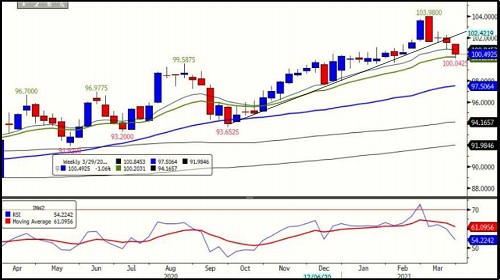
GBPINR April futures closed below 13 Weeks moving average. Short term trend turned weak as the pair has broken the rising trend line support. It has near term support of 20 week moving average i.e. 100.40 and breaking of the same will open downside of 99.59.
Momentum oscillator, RSI exited from overbought zone heading towards south suggesting weakness in momentum.
MACD has given negative cross over to MACD Average and heading towards zero line suggesting weakness in the trend.
The above technical evidences suggest bearishness in GBPINR April Futures and short term traders should make short sell below 100.40 for target of 99.58 and 97.50 keeping stop above 101.50
JPYINR
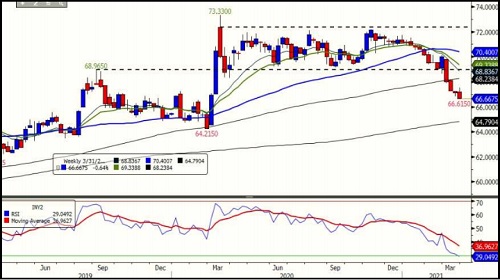
JPYINR April futures closed below 100 weeks simple moving average and heading towards 200 weeks moving average, 64.41.
The pair has rising trend line support at 68.80, adjoining low of 61.53 and 63.90.
Momentum oscillator stochastic entered in oversold zone and MACD line placed below zero line with negative cross over suggesting downward momentum trend.
ADX line started strengthening with –DI placed above +DI suggesting downtrend trend.
Looking at the above technical evidences, we recommend holding of short sell in JPYINR April future for Target of 64.40 keeping short loss at 69.
To Read Complete Report & Disclaimer Click Here
Please refer disclaimer at https://www.hdfcsec.com/article/disclaimer-1795
SEBI Registration number is INZ000171337
Views express by all participants are for information & academic purpose only. Kindly read disclaimer before referring below views. Click Here For Disclaimer





Tag News

EURINR trading range for the day is 89.13 - 89.49. - Kedia Advisory


