Weekly Technical Outlook and Picks : ABDL, JSW Infrastructure Limited and Castrol India Limited by Axis Securities Ltd

Allied Blenders and Distillers Limited
Allied Blenders and Distillers Limited CMP: 714 Buy Range: 700-685 Stop loss: 649 Upside: 13% – 16%
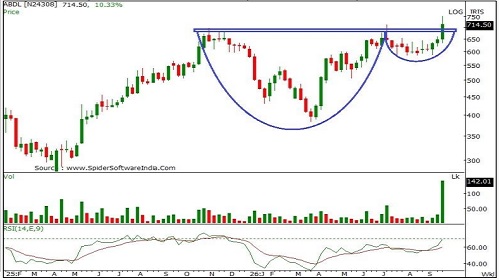
• On the weekly chart, ABDL has formed a strong bullish candle after breaking out of a cup and handle pattern and a 10-weeklong consolidation. The lower bound of the consolidation also coincides with the 38.2% retracement level of the up move from 382 – 711.
• A key point to note is that the breakout has been accompanied by strong volumes, indicating healthy participation and lending further credibility to the move.
• The stock is firmly positioned above its 20- , 50-, 100-, and 200-day SMAs, with all key moving averages trending higher in sync with price action. This confirms a strong bullish structure.
• Weekly RSI is moving higher, indicating increasing bullish momentum in the stock.
• The above analysis indicates upside potential towards the 780 - 805 levels.
Holding Period: 3–4 weeks
JSW Infrastructure Limited
JSW Infrastructure Limited CMP: 363 Buy Range: 357-350 Stop loss: 333 Upside: 11%–15%
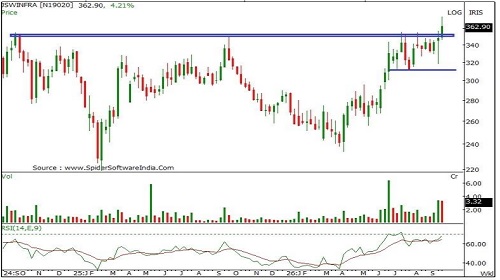
• On the weekly chart, JSWINFRA has formed a strong bullish candle after bouncing off the 20-week SMA and breaking out of a multi-month high. This breakout is also backed by strong volume buildup, indicating participation in the up breakout.
• The Bollinger Bands are showing an interesting pattern, with prices consistently moving between the 20-week SMA and the upper band since Apr’26, reinforcing the overall bullish structure.
• The stock is firmly positioned above its 20- , 50-, 100-, and 200-day SMAs, confirming a strong bullish structure.
• Weekly RSI is moving higher, indicating increasing bullish momentum in the stock.
• The above analysis indicates upside potential towards the 394 - 405 levels.
Holding Period: 3–4 weeks.
Castrol India Limited
Castrol India Limited CMP: 202 Buy Range: 200-196 Stop loss: 189 Upside: 9%–14%
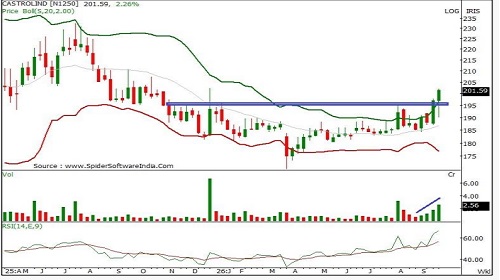
• On the weekly chart, CASTROLIND has finally gained momentum and broken out of a long-term consolidation phase. The stock has formed strong bullish candles over the past two weeks, accompanied by rising volumes, indicating increased participation in the breakout.
• The stock has been riding the upper band of the Bollinger Bands (20,2), while the bands have also started to expand, indicating rising volatility as prices move higher.
• The stock is firmly positioned above its 20-, 50-, 100-, and 200-day SMAs, confirming a strong bullish structure.
• Both the weekly and daily RSI are trending higher, indicating strengthening bullish momentum across the short- and mediumterm time frames.
• The above analysis indicates upside potential towards the 216 - 225 levels.
Holding Period: 3–4 weeks
For More Axis Securities Disclaimer https://simplehai.axisdirect.in/disclaimer-home
SEBI Registration number is INZ000161633