
Buy Mahindra & Mahindra Ltd for the Target Rs 3,860 by Prabhudas Liladhar Ltd
Resilient Quarter, Farm Tilling Through a Soft Patch
MM’s Q2FY27 standalone operating revenue marginally beat estimates, while farm margins were weaker than expected. Expected softening of some RM, calibrated price increases, cost reductions and operating leverage are expected to improve overall margins in the near term. Core tractor margin is expected to be under pressure in Q3FY27, improve in Q4, normalize in FY28, whereas consol farm margins will be cushioned by international business restructuring benefits, pricing and accelerated exports. FY27 volume guidance for its SUVs was maintained at mid-to-high teens. All of its businesses, including the Growth Gems are also on track to scale up and deliver market leading returns. We estimate volume/realization CAGR of 7.4%/4.3% over FY26-29E, translating into revenue/EBITDA/APAT CAGR of 12.0%/10.0%/10.1%. We reiterate ‘BUY’ rating with TP of INR3,860 (previous INR3,750), valuing the core business at 22x P/E on Sep’28E standalone EPS, and its share of subsidiaries’ value.
Gross margin contracts 360bps YoY to 20.8%:
Standalone op revenue of INR424.8bn (+27.1% YoY, +1.3% QoQ) beat BBGe/PLe by +2.7%/+1.1%. Realization was INR942.2k (+9.3% YoY, +5.2% QoQ). EBITDA margin at 11.7% (-290bps YoY, -50bps QoQ) missed BBGe/PLe by -40bps/-25bps. EBITDA was INR49.5bn (+1.8% YoY, -3.2% QoQ), missed BBGe/PLe by -1% each. Adj PAT was INR51.0bn (+12.9% YoY, +38.4% QoQ) beat BBGe/PLe by +12.6%/+10.2%, driven by higher other income. H1FY27 (YoY): standalone op. revenue was INR844.0bn (+25.0%); gross margin at 21.4% (-275bps); EBITDA margin of 11.9% (-250bps) and Adj PAT was INR87.9bn (+10.2%).
Q2 SUV revenue leadership maintained (24.3% market share; -110bps YoY, -30bps QoQ): eSUV revenue market share at 30.1% (#2 player). Standalone Auto PBIT margin stood at 7.7% (excluding eSUV CMA it was 9.1%; -120bps YoY, +80bps QoQ) despite inflationary pressures. MM maintained its leadership in LCV <3.5T (52.3% market share; -90bps YoY, -50bps QoQ), and e3W (36.2% market share). Leadership was also maintained in Farm (41.5% market share; -150bps YoY). Farm standalone PBIT margin stood at 16.8% (-300bps YoY) while core tractor PBIT margin was 17.6%.
Capacity expansion plans intact and on track:
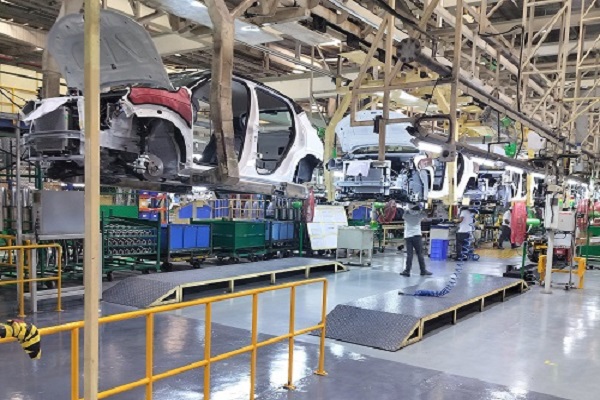
Capacity at FY26-end stood at 56.5k/8k units of ICEs/BEVs p.m. At the end of H1FY27, capacity expanded to 60k/8k units p.m., which should further increase to 70k/12k units of ICE/BEV by H2FY27 exit. Another 10k units p.m. from NU_IQ platform at Chakan should take total FY28 exit capacity to 92k units. Beyond this, the Nagpur Greenfield plant should add 20k units p.m. each by H1FY30 and H1FY31 to take total capacity to 132k units (~2x over FY26-end).
Please refer disclaimer at Report
SEBI Registration number is INH000000933