Weekly Sectoral Outlook 27th October 2025 by GEPL Capital Ltd
INFERENCE & EXPECTATION
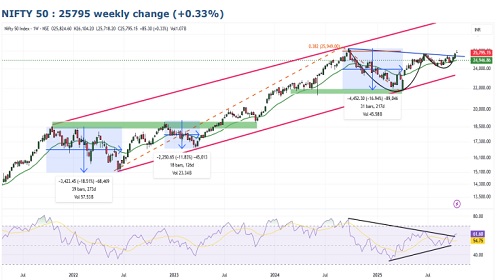
* As discussed in our previous report the positive view post breakout but profit booking triggered in the last day of the week. Since the start of the October series, the index has exhibited positive price action within an upward trend. Consequently, the daily RSI cooled off from the overbought zone, triggering profit booking for two consecutive days around the 26,000 level, which also aligns with the 38.2% Fibonacci extension. Looking ahead, 25,400 is likely to act as a key support, in line with the sloping trendline from September 2024 and near the 20-day EMA. The medium- to long-term outlook remains constructive, as the index has statistically completed its corrective phase in both time and price wise. With the last week’s breakout from the large “Cup & Handle” pattern and the weekly RSI holding above 60—indicating robust structural improvement—a buy-on-dip strategy is advisable in the current market scenario.
* For Traders: Fresh long positions may be considered on dip near 25500 - 25,400, with upside targets of 26,000 (2.36%) and 26300 (3.54%). A stop-loss at 25150 (-0.98) on closing basis is advised to manage risk effectively.
* For Investors: Accumulation is recommended on dips towards 25400–24900 levels, with a medium-term upside target of 28600, offering substantial potential. A stop-loss at 24300 on closing basis is advised to manage risk effectively.
Observation
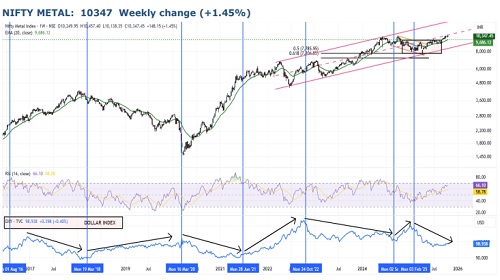
* On the monthly scale, the Nifty Metal Index continues to trade within a well-defined rising channel since April 2022, maintaining a pattern of higher bottoms. Statistically, the index has witnessed an average price retracement of around 28% during corrective phases. In April 2025, it completed its recent cool-off phase with a 26% retracement from the top of 10,322. Subsequently, in September, the index broke out of a 10-month consolidation zone, and the current month is exhibiting follow-through positive sentiment, reinforcing the continuation of the prevailing uptrend.
* Historically, the Nifty Metal Index and the Dollar Index have demonstrated a clear inverse relationship. As depicted in the chart, the lower panel represents the Dollar Index, with vertical markers indicating key turning points since 2016. Each major decline in the Dollar Index has coincided with an upswing in the Metal Index. The current setup aligns with this historical pattern, strengthening conviction that the Metal Index is poised to continue its outperformance in the coming phase.
* On the weekly timeframe, the RSI holding above 60, currently at 66, reflects sustained bullish momentum and further supports the ongoing strength in the index.
Inference & Expectations
* Our analysis suggests the index is poised for an upward move, with a potential target of 12300 and 13000. However, a decisive break below the 9500 level would invalidate the bullish outlook.
Observation
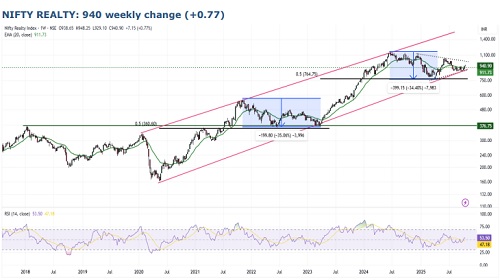
* The Nifty Realty Index has been trending within a rising channel since 2020, consistently forming higher tops and higher bottoms. Structurally, the index continues to exhibit positive price development with a repetitive and statistically consistent retracement pattern during each corrective phase.
* Historically, the index has witnessed average retracements of around 39% within its ongoing uptrend. Following the COVID-19 bottom, the index recovered after a 50% correction. Subsequently, in March 2023, it found support after a 35% decline, aligning with the 50% Fibonacci retracement of the prior upswing.
* Most recently, in April 2025, the index again bottomed out at a 34% correction, coinciding with the 50% retracement zone, reaffirming the statistical rhythm of its bullish structure and indicating that the primary uptrend remains intact.
* On the weekly scale, the index has closed above its 20-week average, while the RSI reading of 53 reflects a renewed build-up in momentum.
Inference & Expectations
* Our analysis points to a bullish outlook, with potential upside targets at 1060 and 1150. However, a sustained move below the 855 level would invalidate this bullish view.
SEBI Registration number is INH000000081.
Please refer disclaimer at https://geplcapital.com/term-disclaimer


Tag News
The Nifty has its crucial resistance 24500(Pivot Level) and 24600(Key Resistance) - GEPL Cap...