

Weekly Sectoral Outlook 27th March 2026 by GEPL Capital Ltd

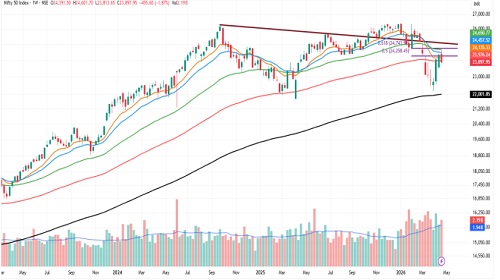
NIFTY 50 : 23897.95 weekly change (-1.87%)
inference & Expectations
* The index has witnessed profit booking following three consecutive weeks of a strong bullish phase, with the recent decline emerging from the 24,600 zone. This level is technically significant as it coincides with the 20-week EMA and aligns with the golden Fibonacci retracement zone, making it a natural area for supply to emerge. As highlighted in the previous report, the short-term market breadth had reached extreme levels, indicating an overheated setup. The current phase of consolidation and pullback reflects a healthy cooling-off process after the sharp upmove, validating the earlier cautious view. On the daily timeframe, the index has now breached the crucial support level of 24,000 along with the 20-day EMA, which signals a shift in near-term sentiment towards caution. A sustained move below 24,300 is likely to keep the bias subdued, while any recovery above this level could help stabilize sentiment and reduce immediate downside risks.
* For Traders: Short positions may be considered below 23700. Then index holds downside potential towards 23100. To manage risk effectively, a stop-loss should be placed at 24300 on a closing basis.
* For Investors: Investors can consider accumulating at 23000– 24300bzone. The target for this investment is set at 28600 level, offering significant upside potential.
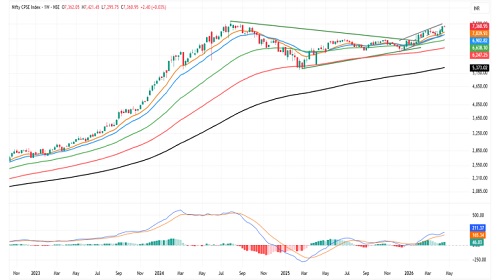
NIFTY CPSE: 7360.95 weekly change (+0.03%)
Observation
* The Nifty CPSE Index has exhibited a robust structural uptrend since 2020, reflecting sustained strength across the PSU space. In January 2026, the index confirmed a breakout from a triangular consolidation pattern, signaling a resumption of its broader upward trajectory.
* On the daily scale, the index continues to maintain a higher high –higher low structure, reinforcing the ongoing bullish trend. It is also consistently respecting its key 12, 26, and 50 DEMA levels, which highlights strong trend adherence and underlying buying interest at crucial supports.
* From a momentum perspective, the MACD indicator remains sustained above the equilibrium line, indicating continued positive momentum and strength in the prevailing trend.
Inference & Expectations
* Looking at the overall structure of prices and the evidence provided by indicator we can infer that the NIFTY CPSE is in positive trend.
* We expect the Index to remain positive with the potential upside would be 7600.
* Going ahead we expect the Index to remain bullish until 7150 is not breached decisively downward.
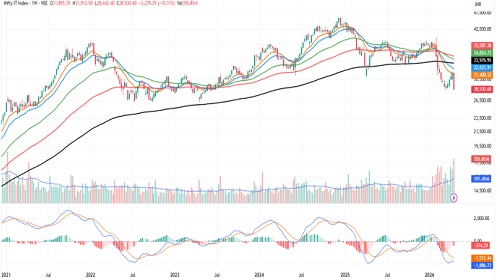
NIFTY IT: 28530.60 weekly change (-10.31%)
Observation
* The NIFTY IT has been exhibiting prolonged underperformance since 2024, consistently forming a pattern of lower tops and lower bottoms, which reflects a sustained weak trend.
* The index continues to trade below its key moving averages, including the 20, 50, and 100-week EMAs, indicating a prevailing bearish bias.
* On the weekly timeframe, the current week has wiped out the gains of the previous four weeks, largely impacted by weaker-than-expected quarterly results from key constituents.
* Furthermore, the MACD momentum indicator is trending downward in negative territory, reinforcing the acceleration in downside momentum
Inference & Expectations
* Based on the overall price structure and the evidence supported by indicators, it can be inferred that the NIFTY IT Index trend is weak.
* We expect the Index to remain weak with the potential downside would be 26200 level.
* Our view will be negated if we see prices sustaining above 30000.
SEBI Registration number is INH000000081.
Please refer disclaimer at https://geplcapital.com/term-disclaimer


Tag News
The index opened on a gap-up note and traded within a narrow range during the first half of ...


