This setup hints at a potential panic bottom and a reversal in sentiment - Tradebulls Securities Pvt Ltd

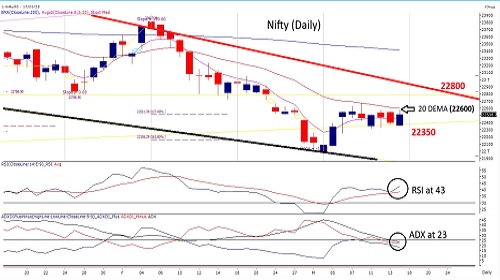
Nifty
Yesterday the Nifty 50 showcased a strong bullish candlestick pattern on the daily charts, closing above its 5-day EMA—a positive signal reinforced by a decline in volatility (India VIX). This suggests that bulls are still in control. However, Nifty stands at a critical technical crossroads, forming an 'Inside Bar' on the weekly scale near the Wedge pattern breakdown zone. This setup hints at a potential panic bottom and a reversal in sentiment. For a sustained bullish breakout, Nifty must secure a decisive close above 22,710 (5 WEMA). The Ending Diagonal pattern on the daily chart highlights crucial levels at 21,800 and 23,040, with 22,200–22,000 serving as a key support zone. Options data points to a well-defined range of 22,200–22,700 for the week, with an upward shift likely. A breakout above 23,040 would mark a major trend reversal, triggering aggressive buying and a sentiment shift. In the near term, Nifty faces resistance at 22,600–22,700. Sustaining above this zone could propel a sharp uptrend toward 23,000, while failure to do so may extend consolidation, with 22,300 acting as a crucial support level.
Please refer disclaimer at https://www.tradebulls.in/disclaimer
SEBI Registration number is INZ000171838