The Bank Nifty Index the week on a positive note at 54055 on back of positive global cues - ICICI Direct

Nifty :23719
Technical Outlook
Week that was.. Indian equity benchmarks recovered a portion of the previous week’s losses, as renewed optimism surrounding potential peace negotiations fueled the momentum in the market. The Nifty gained 0.3% at 23719. In the process, Midcaps continued with its relative outperformance by gaining 1.4%. Sectorally, IT, Realty outshone while consumption, PSU underwent profit booking
Technical Outlook:
• The index started the week on a positive note. However, lack of strength at higher levels resulted into index confining within last week’s bear candle. Consequently, weekly price action formed a small bull candle with a higher low, indicating pause in corrective bias.
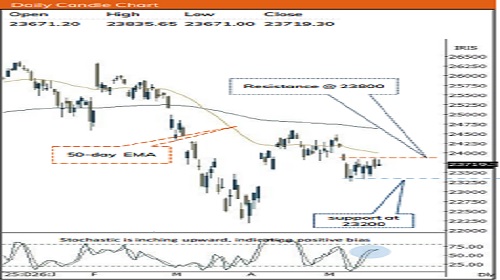
• Index is likely to open gap-up on back of Us-Iran peace deal optimism and fall in crude prices. Index is likely to open above past eight sessions narrow range of 23800, indicating resumption of uptrend. This tightrange price behavior occurred while navigating geopolitical concerns, crude price volatility, shifting bond yields, and fluctuations in the USDINR pair. Ultimately, this prolonged sideways movement signifies a healthy consolidation process, effectively establishing a strong base for the next major leg upward towards 24400
• Going ahead, we expect index to resolve out of upper band of consolidation placed at 23800 that coincides with the 20 days EMA, and resumed upward momentum that can drive Nifty towards 24400 in the coming weeks.
• In the upcoming truncated week, we expect bouts of volatility to remain elevated ahead of monthly expiry and ongoing earning season. Thereby, focus should be on accumulating quality stocks backed by strong earnings as strong support is placed at 23200 being 61.80% retracement of previous move (22182-24601) and the price gap support from 7th April 2026.
• We expect broader market to relatively outperform the large caps as the ratio chart of Nifty 500 vs Nifty 100 has been inching upward, confirming sustained outperformance of the broader market backed by improving market breadth. Amidst geopolitical uncertainties, currently 72% of Nifty 500 stocks are trading above their 50 days SMA compared to last week’s reading of 68%.
Key Monitorable:
• The Bernt crude oil has been forming a lower top formation over past ten weeks. The lack of follow through strength above $120, amid ongoing geopolitical conflict suggest that supply risk are fully priced in. negativity is already priced-in. Hence, a decisive close below $96 would confirm change in prevailing trend and result into extended correction
• The pair of USD/INR approached the extreme overbought reading of 84 (highest since 2002). Further, Gravestone Doji candle on the weekly chart signifies, potential trend exhaustion and an impending reversal in favor of the Rupee.
• US and India GDP data
Intraday Rational:
• Trend - Supportive efforts emerged from 50% of its preceding upmove (22182-24601)
• Levels - Buy around 50% retracement of yesterday range
Nifty Bank : 54055
Week that was: The Bank Nifty Index the week on a positive note at 54055 on back of positive global cues. Nifty PSU Bank relatively underperformed closing flat.
Technical Outlook:
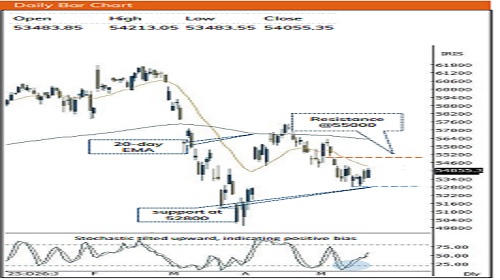
• Index started the week with gap-down action however witnessed supportive efforts from 61.8% retracement of entire April rally (49954-57456) around 52800 levels. The weekly price action resulted into piercing line candle with lower shadow, indicating buying demand at lower levels
• Index has formed bullish Piercing line candlestick at key 61.8% retracement level. Key point to highlight is that, it has taken four weeks to retrace previous four weeks rally indicating slower pace of retracement. Going ahead, we expect index to resolve out of recent consolidation towards 56500 being 80% retracement of recent decline
• Index is firmly holding above gap-area support formed on 7th April and 61.8% retracement of entire April rally (49954- 57456) at 52800 making it strong support in short term.
• Nifty PSU Bank formed small bull candle in vicinity of 52- week EMA coincided with April low of 7830. The sustainability above 7800 mark signifies supportive efforts at key support zone that would eventually help index to stage a recovery going ahead
Intraday Rational:
• Trend- Weekly bullish candle in the vicinity of 61.8% retracement of its preceding up-move (49954-57456)
• Levels- Buy around 50% retracement of yesterday range
Please refer disclaimer at https://secure.icicidirect.com/Content/StaticData/Disclaimer.html
SEBI Registration number INZ000183631