Spreads Decline as Interest Rate Transmission Gains Pace by CareEdge Ratings
Synopsis
* In June 2025, the spread between the outstanding (o/s) weighted average lending rate (WALR – Lending Rate) and the o/s weighted average domestic term deposit rate (WADTDR – Deposit Rate) for scheduled commercial banks (SCBs) decreased by 15 basis points (bps) on a month-on-month (m-o-m) basis, to 2.45%.
* The SCBs’ lending rate on o/s rupee loans fell by 22 bps m-o-m to 9.45%, driven by rate cuts, weaker credit demand and competitive pressures. Additionally, the lending rate fell faster due to a higher share of floating-rate loans.
* The deposit rate on o/s rupee term deposits also decreased by seven bps to 7.00%, driven by a 26- bps reduction of foreign banks (FBs), a 10 bps and a 5-bps reduction in private sector banks (PVBs) and public sector banks (PSBs), respectively.
* In June 2025, SCBs’ fresh spread compressed by 22 bps to 2.87%. Surplus liquidity, rate cuts, and muted credit demand pushed banks to reduce rates on fresh loans. o As of June 2025, lending rate on fresh loans for SCBs fell by 58 bps m-o-m to 8.62%, while fresh deposit rate also declined by 36 bps m-o-m to 5.75%.
* In June 2025, the one-year median MCLR declined by 10 bps and stood at 8.75%. Further, MCLR of PVBs and FBs declined by 30 and 88 bps, respectively, reaching 9.60% and 7.07% due to faster transmission of rate cuts than PSBs, which fell by five bps and stood at 8.95%.
Deposit Growth Outpaces Credit Offtake; Systemic Liquidity Remains in Surplus
Figure 1: Credit Offtake vs Deposit Growth Figure 2: Monthly Bank System Liquidity (Rs lakh cr)
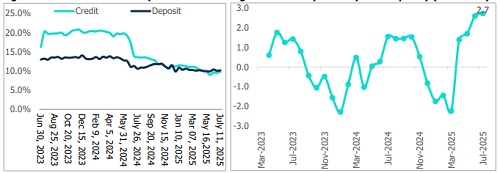
* Credit offtake rose by 9.8% y-o-y for the fortnight ending July 11, 2025, and came in slower than the previous year’s growth of 16.2% (excluding the merger impact). This slowdown can be attributed to weaker momentum and a higher base effect. A significant part of the slowdown is due to the marked cooling in lending to NBFCs, unsecured personal loans and microfinance loans. However, retail credit has continued to experience some growth. At the same time, on the corporate side, capex remains muted amid uncertainties surrounding the tariff situation and the availability of alternative borrowing options for large corporates at competitive rates, leading to subdued loan demand. Meanwhile, deposits increased by 10.1% y-o-y, reaching Rs 233.3 lakh crore as of July 11, 2025, lower than the 11.7% growth (excluding merger impact) recorded last year. Banks have continued to rely on certificates of deposit to meet their funding needs, amid subdued deposit growth.
* As of end-July 2025, the RBI continued to maintain surplus liquidity conditions in the banking system, with the average surplus remaining elevated at around Rs 2.7 lakh crore. For the fourth consecutive month, systemic liquidity stayed in surplus, aided by Longer-tenor VRR operations and OMO purchases. With surplus funds mounting, peaking at the Rs 3?lakh?crore mark system-wide, the RBI transitioned to absorption mode, conducting a sequence of VRRR auctions. Dollar-rupee swap operations complemented these steps. This has further supported the smooth transmission of the recent policy rate cuts across the financial system.
O/s Spread Witness a Downtick in June 2025
Figure 3: Evolution of Spreads (Outstanding)
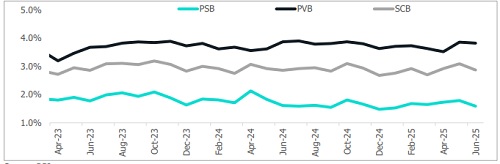
As of June 2025, the outstanding spread between lending and deposit rates for SCBs declined by 15 bps m-o-m to 2.45%. PSBs, with lower Credit-to-Deposit (CD) ratios compared to PVBs, had a greater room to expand credit. PSBs' lending, particularly to lower-yielding segments such as housing, contributed to a decline in their aggregate yield on advances. Consequently, the outstanding spread for PSBs narrowed by 19 bps to 1.69%, while for PVBs, it moderated by 8 bps to 3.38%. The reduction in lending rates was more pronounced due to the high proportion of floating-rate loans in bank portfolios. Additionally, muted credit demand, especially in high-yielding segments like unsecured retail, and competitive pressures have further pressured lending yields.
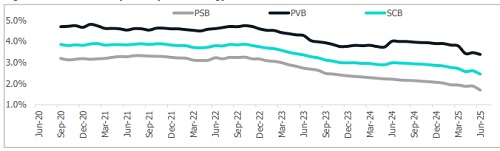
Outstanding Business: Deposit and Lending Rate Decline
Figure 4: Evolution of WALR O/s Lending Rate Figure 5: Evolution of WADTDR O/s Deposit Rate
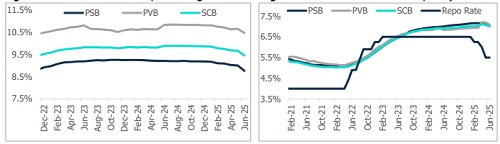
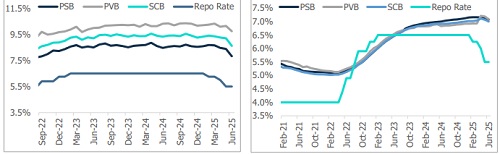
* As of June 2025, SCBs' outstanding lending rate decreased 22 bps m-o-m to 9.45%, PSBs and PVBs by 24 and 18 bps to 8.76% and 10.47% respectively. The decline was largely driven by the RBI’s repo rate cut to 5.50%, with PSBs quicker to pass on the rate cuts, along with subdued loan demand. Meanwhile, the outstanding deposit rates of SCBs declined by 4 bps to 7.07%, which was attributed to surplus liquidity and the repricing of deposit portfolios toward lower market rates. PSBs, PVBs and FBs declined by five, ten and 26 bps, at 7.07%, 7.09% and 5.39% respectively.
MCLR Rates Decline with rate cuts
Figure 6: Movement in 1-Year MCLR (Median)
On a m-o-m basis in July 2025, the one-year median MCLR decreased by 15 bps and stood at 8.75%, attributed to policy rate adjustments. In July 2025, we are seeing the effects of the lagged transmission, as deposit rates have started to decline, bringing down the MCLR across banks. Moreover, it fell by 10 bps on a y-o-y basis and remains 55 bps above the pre-pandemic level of February 2020.
Figure 7: MCLR Rates (in %) PSBs Moderated, While PVBs saw Steeper Decline m-o-m
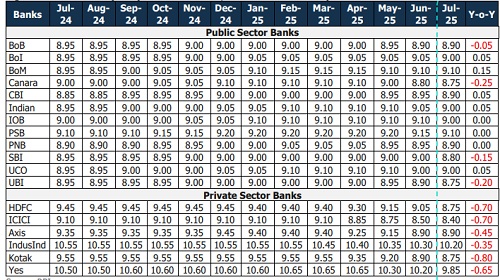
Figure 8: Evolution of Spreads (Fresh)
* In June 2025, fresh spreads declined m-o-m, with SCBs falling by 22 bps to 2.87%, PVBs by four bps to 3.82%, and PSBs by 20 bps to 1.79%. The sharper drop in PSBs’ spreads was driven by their more aggressive reduction in fresh lending rate following the policy rate cuts, while deposit rates declined marginally.
* For SCBs, as of June 2025, fresh spreads are higher than outstanding spreads, suggesting that the transmission of policy rate cuts is more visible in the outstanding book, while fresh loans are being priced with relatively higher margins.
Fresh Lending Rates and Deposit Rates Witness a Downtick
Figure 9: Evolution of Lending Rate Fresh Loans Figure 10: Evolution of Deposit Rate Fresh
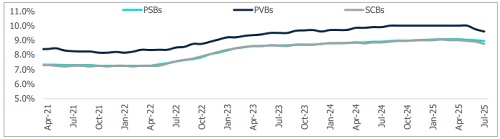
* The lending rate on fresh loans for SCBs decreased significantly by 58 bps m-o-m, settling at 8.62%. PSBs and PVBs saw a decline of 56 and 41 bps, standing at 7.82% and 9.74% respectively, as of June 2025, attributed to surplus liquidity, weaker loan demand and rate cuts. Additionally, fresh deposit rates for SCBs decreased by 36 basis points m-o-m, reaching 5.75%. PSBs and PVBs saw a decrease of 36 and 37 bps each, standing at 6.23% and 5.92% respectively, as of May 2025, attributed to banks cutting deposit rates to manage funding costs for protecting their margins.
Conclusion
According to Sanjay Agarwal, Senior Director, CareEdge Ratings, “In June 2025, SCBs witnessed compression in spreads amid the ongoing rate transmission. Fresh spreads are higher than outstanding spreads, showing that the transmission of policy rate cuts is more visible in the outstanding book, while fresh loans are being priced with relatively higher margins. The greater proportion of EBLR-linked loans, such as those tied to the repo rate or Tbills, in PVBs enabled faster transmission compared to PSBs. With liquidity measures taken by the RBI, banks have been able to reduce the deposit rates. The demand for retail credit remains subdued. Furthermore, banks are showing reduced appetite for aggressive credit expansion amid sustained margin pressures. However, lenders with relatively stable cost of funds and better pricing power have been able to maintain healthier spreads.”
Above views are of the author and not of the website kindly read disclaimer