SIP Analysis Report 8th November 2025 by WhiteOak Capital

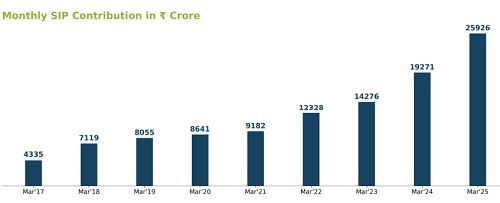
Over the years, the Systematic Investment Plan (SIP), a feature offered by Mutual Funds, has become a household name. Its popularity among investors can be seen from the graph given below, which depicts growth in monthly SIP contribution by investors over the last ten years.
With growing interest in SIP, a few obvious questions come to an investor’s mind. This study, conducted by WhiteOak Capital Mutual Fund, attempts to address some of these commonly asked questions around SIP investment backed by long-period market indices data. This study aims to provide a holistic picture to our investors so that investors can make betterinformed decisions for their investments. Any calculations shown in subsequent pages are approximations and meant for understanding a particular concept. Past performance may or may not be sustained in future and is not a guarantee of any future returns.
These calculations/views alone are not sufficient and should not be used for the development or implementation of an investment strategy. Investors should consult their financial advisers if in doubt about whether the product is suitable for them.
Q1. What is an Ideal Investment Time Horizon for SIP ?
Experts often suggest investors invest for the “Long-term,” but what exactly is “Long-term”? What is the “Ideal Investment Horizon”? Or is there anything called an “Ideal Investment Horizon”?
Equities have proved to be a volatile asset class in the past. But, the study reveals volatility reduces as investors increase their investment horizon. (Data for BSE SENSEX TRI)
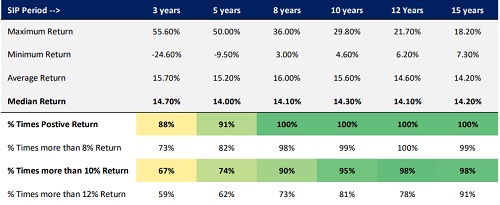
Above returns are %XIRR Rolling Returns on monthly basis for BSE SENSEX TRI for SIP between August 1996 to October 2025.
Investors are requested to note that, mean returns (calculated by taking mean of 10-year rolling returns between 01/06/14 and 30/05/24) for Sensex is 12.62% and for Nifty 50 is 12.42% (Source: AMFI). Past performance may or may not be sustained in future and is not a guarantee of any future returns. Index performance does not signify scheme performance.
The above calculations do not consider stamp duty/levy etc. for ease of calculation and the values shown are pre-tax. Investors may incur tax liability on capital gains based on prevailing tax laws. Any calculations made are approximations meant for understanding a particular concept only. These calculations/views alone are not sufficient and should not be used for the developing or implementing an investment strategy. Investors should consult their financial advisers if in doubt about whether the product is suitable for them.
Q2. Which is better, starting SIP at the Top or Bottom?
First, Let’s accept that it is impossible to consistently predict the exact Top or Bottom of a Market Cycle. At best, one can create and follow a valuation checklist whenever one deviates from their Strategic Asset Allocation, which should help investors reduce portfolio-level volatility to some extent while participating in the equity market.
But still, let’s assume one has some magical power, can predict the exact Top and Bottom, and wants to start a longterm SIP. So, should that investor start SIP at the Top of the cycle or the Bottom? We did a detailed analysis using longperiod data of BSE SENSEX TRI (last ~28 years). We took all those periods when equity market has fallen more than 20% from its Top. The table below is the investment summary of two investors, one who started a Rs. 10,000 monthly SIP at the Top of various market cycles and the other at the Bottom:
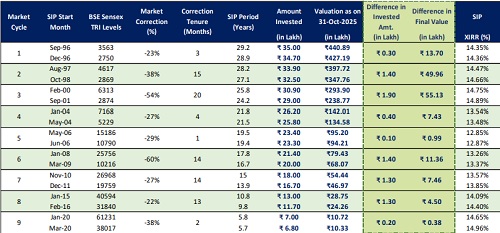
How to read the above table: For example, if someone would have started a monthly SIP of Rs. 10,000 in BSE SENSEX TRI during January 2008 (at the peak of market cycle six as per the above table), as of 31-Oct-2025, they would have invested Rs. Rs 21.40 Lakh and the current value of this investment would have been Rs. 79.43 Lakh at an XIRR of 13.26%. Similarly, if somebody had started this SIP in March 2009 (at the bottom of market cycle six as per the above table), as of 31-Oct-2025, they would have invested Rs. Rs 20.00 Lakh (Rs. Rs 1.40 Lakh less than earlier investor) and the current value of this investment would have been Rs. 68.07 Lakh (Rs. Rs 11.36 Lakh less than earlier investor) at an XIRR of 13.37%.
Some Findings:
1. It is interesting to note that while the % return is marginally higher for SIPs started at the bottom of the market cycle, the absolute gain in rupee term (Wealth Creation) is far higher for SIPs that began at the top.
2. The “Cost of Delay” of starting SIP late can be huge over the long term. The longer the market takes to reach the bottom, the higher the “Cost of Delay,” keeping all other things constant.
3. Even the marginal difference of % return goes away over the long-term, irrespective of whether you started at the top or bottom (refer to the return difference for SIPs during the first 6 Market Cycles, i.e. in long-term).
The biggest risk is not the market, but missing out on compounding over time.
Investors are requested to note that, mean returns (calculated by taking mean of 10-year rolling returns between 01/06/14 and 30/05/24) for Sensex is 12.62% and for Nifty 50 is 12.42% (Source: AMFI). Past performance may or may not be sustained in future and is not a guarantee of any future returns. Index performance does not signify scheme performance. The above calculations do not consider stamp duty/levy etc. for ease of calculation and the values shown are pre-tax. Investors may incur tax liability on capital gains based on prevailing tax laws. Any calculations made are approximations meant for understanding a particular concept only. These calculations/views alone are not sufficient and should not be used for the developing or implementing an investment strategy. Investors should consult their financial advisers if in doubt about whether the product is suitable for them.
Q3. Isn’t it better if I time my monthly purchases?
* Only in hindsight would we know, what would have been the best day to invest during a month. It is impossible to consistently time the market levels.
* Waiting for the right time to invest can lead to missed opportunities
* Not investing at all is likely to be more significant loss than entering an unfavorable market
* Even the worst market timing may help grow wealth over the long-term
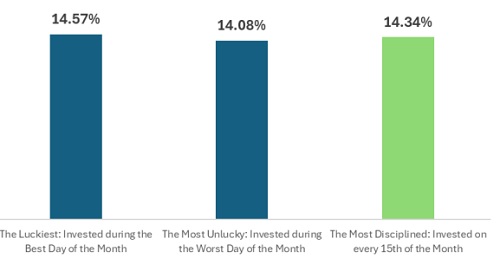
% XIRR for BSE SENSEX TRI for SIP between August 1996 to October 2025.
It’s time in the market, not timing the market
Investors are requested to note that, mean returns (calculated by taking mean of 10-year rolling returns between 01/06/14 and 30/05/24) for Sensex is 12.62% and for Nifty 50 is 12.42% (Source: AMFI). Past performance may or may not be sustained in future and is not a guarantee of any future returns. Index performance does not signify scheme performance.
The above calculations do not consider stamp duty/levy etc. for ease of calculation and the values shown are pre-tax. Investors may incur tax liability on capital gains based on prevailing tax laws. Any calculations made are approximations meant for understanding a particular concept only. These calculations/views alone are not sufficient and should not be used for the developing or implementing an investment strategy. Investors should consult their financial advisers if in doubt about whether the product is suitable for them.
Q4. Large Cap, Mid Cap or Small Cap SIP?
As we all know, an average Large Cap stock is generally less volatile than an average Small and Mid Cap stock and provides stability to the portfolio. However, the Small and Mid Cap (SMID) segments may offer many opportunities for potential higher growth in the long run.
The study reveals that, among the three market cap segments, Mid Cap Segment was a good investment option for investors seeking to invest via the long-term SIP route.
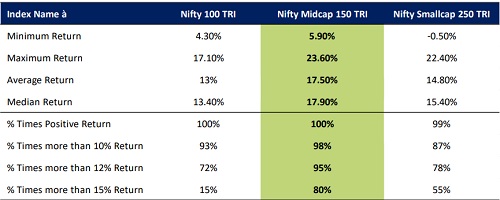
10 Year Monthly Rolling (% XIRR) Return considered from August 1996 to October 2025, first observation recorded on 1-Apr-15.
Q5. Which Date to Select for Monthly SIP?
Start of the Month? End of the Month? Middle of the Month? Near the Last Thursday of the month because of higher volatility due to F&O expiry? Splitting SIP amount into multiple date SIPs?
We tried answering these commonly asked questions using long-period data from BSE SENSEX TRI (a widely tracked Indian Equity Market Index). The study of the last 28+ years' index data reveals no meaningful difference between the average return of different dates’ 10 Years SIPs.
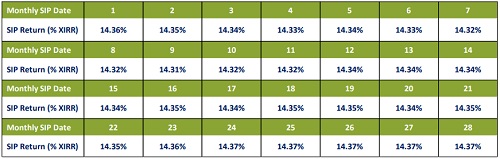
10 Years Average SIP Return (% XIRR) on Daily Rolling Basis for particular date of the month for BSE Sensex TRI between August 1996 to October 2025.
Investors are requested to note that, mean returns (calculated by taking mean of 10-year rolling returns between 01/06/14 and 30/05/24) for Sensex is 12.62% and for Nifty 50 is 12.42% (Source: AMFI). Past performance may or may not be sustained in future and is not a guarantee of any future returns. Index performance does not signify scheme performance.
The above calculations do not consider stamp duty/levy etc. for ease of calculation and the values shown are pre-tax. Investors may incur tax liability on capital gains based on prevailing tax laws. Any calculations made are approximations meant for understanding a particular concept only. These calculations/views alone are not sufficient and should not be used for the developing or implementing an investment strategy. Investors should consult their financial advisers if in doubt about whether the product is suitable for them.
Above views are of the author and not of the website kindly read disclaimer