Sensex Closes Above 200-DEMA After 5 Months - ICICI Direct

Sensex : 78639
Technical Outlook
Day that was ..
Indian equity benchmark began the month of August on a strong footing tracking renewed diplomatic talk between US-Iran and sharp decline in crude oil price. Index settle the day at 78639, up 0.7%. Marke breadth was overwhelming positive with an (A/D) ratio of 2.4:1. Broader market performed in tandem with the benchmark, with Nifty Mid and Smallcap gaining 1.2% each. Sectorally, all major indices closed in green while IT, BFSI, Auto and Metals outshines.
Technical Outlook :
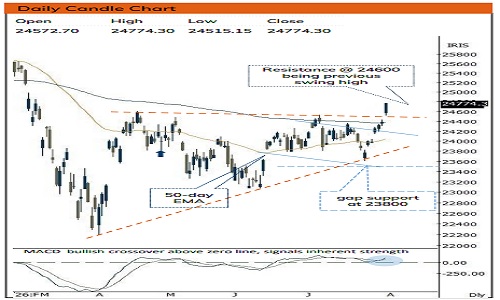
• Sensex started the week with a positive gap-up and closed above its 200- day EMA for the first time in the past five-months, indicating healthy structural improvement. As a result, the daily price action has resulted into “Run-away gap” candle carrying higher high-low structure, indicating positive bias.
• Key highlight is that, Nifty has witnessed faster pace of retracement with previous 14-session entire decline is recovered in past 6 trading session, highlighting strong buying interest emerged from lower levels. Meanwhile, Index has also approached towards upper band of past three months consolidation placed at 24600. Hence, a decisive breakout above 24600 would trigger the next leg of up move towards 25500 in coming months led by Banking, Auto, Metal, Pharma, Defence. Thereby, any decline from current level should be utilize as buying opportunity with strong Q1 earning as strong support is placed around 23800 being 80% retracement of current up move
Our constructive stance is based on following observations :
I. Nifty reclaimed its 200 days EMA (24370) after 5 months. Going ahead, sustainability above the same would be the first sign of conclusion of past three months consolidation.
II. After 7 months, Nifty closed above its previous months high, highlights structural improvement in larger degree time-frame.
III. After ~11% surge in April, Nifty’s 1500 points consolidation phase absorbed major geopolitical headwinds and formed higher base around the 3-months upward sloping trendline (joining the lows of April and June 2026). Thereby established durable higher base.
IV. The optimism around Q1 earnings is shifting from large caps to midcaps. Following 5 weeks breather in the vicinity of All time high, the Midcap Index has regained momentum.
V. Decline in Brent crude oil (-13%) along with breakdown in US Dollar index provides fuel for the emerging markets
VI. Historically, seasonality favours August month, delivering positive returns on six out of ten occasions with an average gain of 3%
VII. July FII’s net selling dropped to ~6000 cr. which is drastically low compared to past six months average of 57000 cr. As global volatility around AI trade mounts, we believe, focus would start shifting back to growth oriented Indian market.
Key Monitorable :
a) RBI Monetary Policy
b) Falling Crude Oil
c) Sustenance of US Dollar index below $100 would provide cushion to Indian equitie
Intraday Rational :
• Trend – Faster pace of retracement, previous 14-session entire decline recouped in past 6-session, signals strong buying demand from lower level.
• Levels – Buy around Mondays gap area and 38.2% retracement of last 2 days range
Nifty Bank : 58247
Technical Outlook
Day that was :
Bank Nifty ended the first day of week on positive note up 1.72% at 58248 on back of mixed global cues.
Technical Outlook :
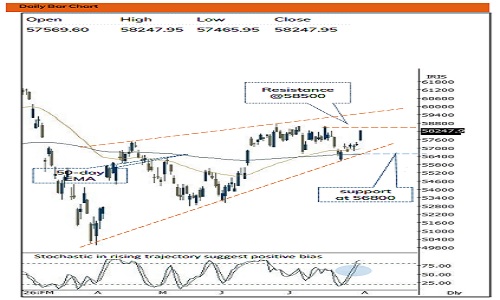
• Index started the week with a positive gap-up and closed above its 20-day EMA after 8 sessions, indicating healthy structural improvement. As a result, the daily price action has resulted into “Run-away gap” candle carrying higher high-low structure, indicating positive bias.
• Going ahead we expect, index to resolve out of one month consolidation range , upper band of consolidation placed at 58500 in coming month and open the door for next leg of upmove. The key support zone of 56800 is a placement of the 50-day EMA coinciding with 61.8% retracement of recent rally (56024-58248).
• Another observation is that over last 4 weeks Index has retraced by 38.2% of earlier 3 weeks rally, indicating slower pace of retracement which would help to set stage for next leg of rally.
• The PSU Bank Index has closed above 50-day ema after 8 session, indicating buying demand from key moving average. Going ahead follow through strength above last week(8423) high would set the stage towards 8700 levels
Intraday Rational :
• Trend - Enduring above cluster of key moving average, indicating inherent strength
• Levels – Buy around 50% retracement of last 2 days range
Please refer disclaimer at https://secure.icicidirect.com/Content/StaticData/Disclaimer.html
SEBI Registration number INZ000183631