
Sell Silver Around 171500 SL ABOVE 172500 TGT 170000/169000 - Axis Securities Ltd

Macro
• Gold prices opened lower in the morning session, declining by more than 0.5% to trade around the $3,860 level. A breakout in the US Dollar Index, which is trading above 103.4, coupled with the Fed's hawkish stance, has dented the appeal of bullion. We expect gold prices to maintain a negative bias as long as the $4,000 level acts as resistance.
• Nymex crude has been trading under pressure since the morning session, declining by more than 1% to trade around the important demand zone of $86 per barrel. A surge in US crude inventories, coupled with an increase in production forecasts, is acting as a headwind for prices. We expect crude oil prices to consolidate within the $85–$92 range this week.
• Copper futures declined towards $6 per pound, approaching fresh four-month lows, as a stronger US dollar weighed on base metals amid growing expectations of tighter Federal Reserve policy following hotter-than-expected inflation data. Additionally, a rise in LME inventories to near five-month highs has further contributed to the sell-off in copper prices.
Panel One
* 15-minute candlesticks for a rolling three-day period have been plotted.
* Blue horizontal line shows an open gap which could either be up or down (open-gap up: low of next candle does not overlap the high of the prior candle, and vice versa for an open-gap down). The horizontal line showing the gap will only appear if the price has not visited the gap area.
Panel Two
* Plots the Slow Stochastics study to identify overbought (90 and above) and oversold (20 and below) areas.
* Signals are generated when the fast line (black) crosses the slow line (blue).
Panel Three
* Plots the Fisher Transform study that helps identify extremes and makes turning points clearer.
* Red bands lie between +2 and +3 and can be thought of as an area where a peak could occur. Green bands lie between -2 and -3 and often mark bottoms.
Gold
SELL GOLD AROUND 135200 SL ABOVE 135600 TGT 134600/134000.
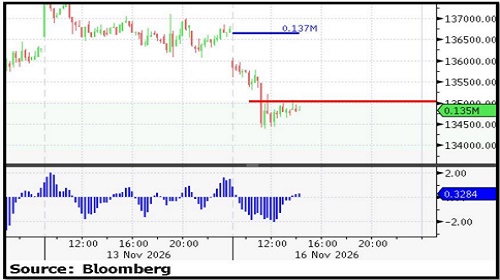
* Nearby Support: 1,34,000/ 1,33,500
* Nearby Resistance: 1,35,200/ 1,36,000
* Nearby Gaps: 137,000
Silver
SELL SILVER AROUND 171500 SL ABOVE 172500 TGT 170000/169000.
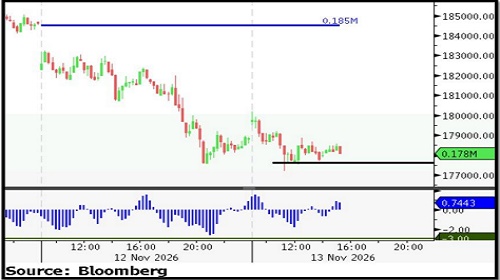
* Nearby Support: 1,69,000/ 1,67,000
* Nearby Resistance: 1,71,000/ 1,73,000
* Nearby Gaps: None
Crude Oil
BUY CRUDEOIL ABOVE 8400 SL BELOW 8300 TGT 8550/8700.
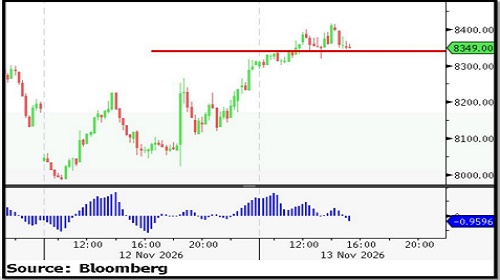
* Nearby Support: 8,300/ 8,200/ 8,050
* Nearby Resistance: 8,400/ 8,500/ 8,600
* Nearby Gap(s): None.
Copper
SELL COPPER AROUND 1295 SL ABOVE 1302 TGT 1285/1270.
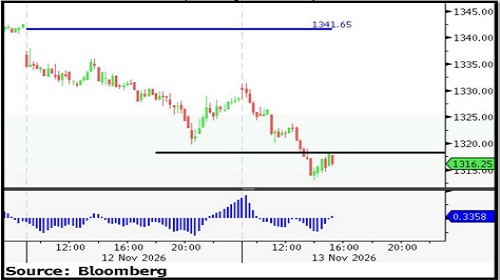
* Nearby Support: 1,280/ 1,270
* Nearby Resistance: 1,295/ 1,305
* Nearby Gap(s): None
For More Axis Securities Disclaimer https://simplehai.axisdirect.in/disclaimer-home
SEBI Registration number is INZ000161633