Revival Signs in India`s Capex Story: CareEdge Ratings
According to CareEdge ratings, the capex landscape in the fiscal year so far has reflected signs of optimism. While Centre and State government capex continued to stay healthy supporting the overall investment scenario, the encouraging aspect is the revival in capex by Indian corporations. Furthermore, the order books data for a representative sample of capital goods firms, which is a key gauge for future capital expenditure, suggest a favourable outlook for capex. This momentum is expected to generate positive spillover effects across other industries, supporting the broader capex cycle in the economy. Furthermore, CareEdge Ratings projects capex in sectors such as oil & gas and steel to rise in FY26.
CareEdge Ratings analysis indicates that public sector investment has remained upbeat so far this year, with capex by the Centre and state governments (aggregate capex of top 19 states) registering strong double-digit growth. On the corporate capex front, the aggregate capex of 1,899 listed non-financial companies recorded a growth of 11%, rising to Rs 9.4 trillion in FY25. It notes that the uptick seen in investment announcements and completions during H1 FY26 (CMIE data) signals improving investment sentiment.
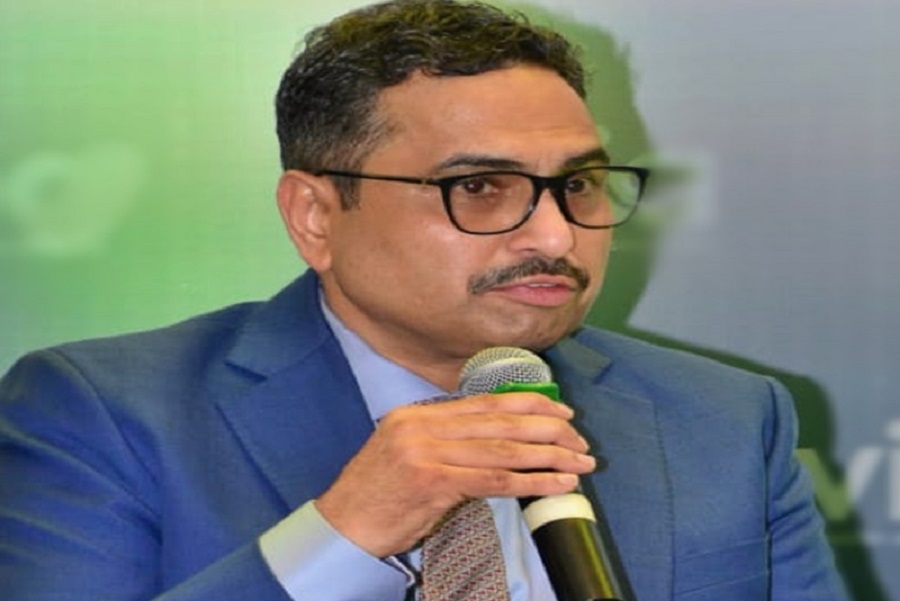
Rajani Sinha, Chief Economist, CareEdge Ratings said, “While Centre’s Capex has been healthy, we have also seen an improvement in aggregate state capex in H1 FY26. Moreover, capex by India Inc is showing improvement, led by sectors like Oil & Gas, Power, Telecom and Auto. The order book of capital goods companies is showing healthy momentum giving us optimism on the capex outlook.
Overall, while the capex outlook appears optimistic, we remain cautious about the challenges arising from an uneven domestic demand recovery, elevated external economic uncertainties and global trade policy headwinds. Amid a volatile global economic environment, a durable and broad-based domestic demand recovery remains critical for sustaining this investment momentum.”
India’s investment-to-GDP ratio has averaged 30.3% over the last four years as against the pre-pandemic average of 28.6% (FY16-19). However, the investment to GDP ratio has moderated marginally to around 29.9% in FY25, as the election-related restrictions weighed on the investment scenario in the first half of last year. CareEdge Ratings expects this trend to likley see a reversal in the current fiscal year, as evidenced by signs of capex revival.
Public Sector Capex Remains Upbeat so far in FY26
The Centre’s capital expenditure surged by 40% (y-o-y) during H1 FY26. A deeper evaluation of Centre’s capex reveals that the share of capex allocated to the Department of Food and Public Distribution rose to 8.6% in H1 FY26, the highest in recent years. So far, Rs 500 billion have been disbursed towards the Department of Food and Public Distribution, marking a notable increase over last year’s disbursement of Rs 39 billion. Adjusting the capital outlay of the Centre for this disbursement towards the Department of Food and Public Distribution, the overall trend in Centre’s capex remained encouraging recording double-digit growth of 29% (y-o-y) in H1 FY26. Among other components, roads and railways remained the top two areas of capex, with the outlay towards these having risen by 21.7% and 5.6%, respectively, during H1 FY26 on a year-on-year basis.
Robust capex of state government fuels optimism
CareEdge Ratings notes that State government capital expenditure (for sample of top 19 states) remained robust in H1 FY26 with state capex rising by 13% (y-o-y). States like Maharashtra, Madhya Pradesh, and Gujarat have recorded strong capex growth in H1 FY26, following healthy growth in FY25. Notably, states such as Telangana, Andhra Pradesh and Haryana registered strong capex growth in H1 FY26, after weak capex performance in the previous year. In Uttar Pradesh, while the absolute capex remains high, H1 FY26 saw a contraction on the back of meagre 3% growth in FY25. Similarly, capex contracted year-on-year in Odisha, West Bengal, and Jharkhand in H1 FY26, following a weak capex trend in FY25.
To support state-level capital spending, the Centre has maintained the allocation for the 50-year interest-free loans under the Scheme for Special Assistance to States for Capital Expenditure at Rs 1.5 trillion in the Union Budget for FY26. It highlights that in H1 FY26, the centre has already disbursed Rs 500 billion under this scheme and has approved another Rs 700 billion of the Rs 1.5 trillion allocated.
The Central Public Sector Enterprises (CPSEs) at an aggregate level have recorded a 13.9% (y-o-y) increase in capex during H1 FY26, reaching Rs 3.85 trillion—approximately 49% of the annual budgeted target. High H1 FY26 capex growth is primarily attributable to a low base, as spending in the first half of the previous fiscal year was subdued, with only about 41% of the annual capex deployed during that period. Given the healthy momentum in H1, CPSEs should meet, or plausibly even marginally exceed, their capex targets for FY26.
Capex by Indian Corporations Picked Up in FY25
To assess the capex trends of Indian corporates, CareEdge Ratings evaluated the annual financial statements of 1,899 listed non-financial companies. The aggregate capex of non-financial companies for the sample was seen at Rs 9.4 trillion in FY25, marking an 11% growth over the last year levels.
The top 6 sectors in which private capex was concentrated were oil & gas (19% share in the aggregate capex) followed by power (15%), telecom (10%), automobile & ancillaries (9%), iron & steel (7%) and non-ferrous metals (5.5%). Of these major capex contributors, strong capex growth (y-o-y) was witnessed in sectors such as power (72.6%), automobile & ancillaries (24.7%) and non-ferrous metals (53.2%).
Looking ahead, CareEdge Ratings project capex in the oil & gas and steel sectors to likely rise in FY26 by 3% and 7%, respectively. However, capex in the aluminium sector is projected to decline by around 10%.
A review of order books across a representative group of capital goods companies shows a sharp rise of 21% in FY25, building on 14% growth in the previous year. It also notes that the order books for a sample of firms in the capital goods sector increased by 7% in the first half of FY26 compared with end-FY25 levels. The increase in the orderbook of the capital goods companies are expected to support capex going forward.
The power generation sector, including both listed and unlisted companies, is estimated to add substantial capacity in FY26, fuelling a significant rise in capital expenditure. We estimate capex for the power generation sector, for both listed and unlisted companies, to grow at a CAGR of 8% over FY26 to FY28. Within the power generation sector, capex in the renewable sector (including storage) is expected to grow at a CAGR of 13% over FY26 to FY28. We expect renewable energy capacity, including storage, to increase from 28 GW in FY25 to 41 GW in FY26 and reach 53 GW by FY28. This projected expansion in the renewable energy sector, led by solar, is expected to support continued capital expenditure within the industry. Increased capex in the power generation sector bodes well for the economy's future growth potential.
H1 FY26 Sees Higher Investment Announcements and Completions Year-on-Year
New investment announcements (CMIE data) were seen at Rs 15.1 trillion in H1 FY26, 15% higher compared to the corresponding period of the previous year. Keeping up with the trend seen in the earlier periods, the investment announcements were mainly led by the private sector with a share of 88% in the total. While, Investment completions were seen at Rs 4.1 trillion during H1 FY26, doubling from a year ago levels. The government sector has remained at the forefront with a 63% share in the total investment completions during H1 FY26.
A large share of total investment announcements during H1 FY26 was concentrated in the manufacturing sector, accounting for 57%. The manufacturing sector investment announcements were led by metals and metal products (41% share in total manufacturing), followed by chemicals and chemical products (36%). In addition to the manufacturing sector, the electricity and non-financial services sectors also saw investment announcements, accounting for 22% and 16% of total announcements, respectively. Investment announcements within the non-financial services sector were mainly led by the transport sector (including transport infrastructure services), with a share of 60%, followed by information technology (mainly Data centres), with a share of 27%.
The investment completions during H1 FY26 were led by the non-financial services, accounting for 61% of the total completions. Within this category, transport services accounted for the majority of project completions mainly led by roads and railways.
Maharashtra Steers the Most Investment Announcements & Completions
In line with trend seen in FY25, Maharashtra continued to lead the new investment announcements as well as investment completions in the first half of the current fiscal year. In H1 FY26, Maharashtra’s new investment announcements were largely driven by the private sector, accounting for 92% of the total, whereas project completions were primarily led by the government, contributing to a 58% share. Among other states, investment announcements during H1 FY26 were driven by Andhra Pradesh and Odisha, together accounting for 31.6% share in the total. In terms of investment completions, other states like Uttar Pradesh, Gujarat and Bihar were at the forefront with a combined share of close to 24% in the total
Above views are of the author and not of the website kindly read disclaimer


