Report on Quarterly Outlook Q3FY26 - Navigating India's Market Crosswinds in FY26 - Equirus Wealth

The AI Hype Cycle: Bigger Than the Dot-Com Bubble?
Technology firms are raising debt at a record pace to fund AI ambitions. Over $157B has been raised YTD in US bond markets (+70% YoY), with spreads near 27-year lows as investors rush to participate.
Capital is flooding into AI. Nearly 65% of US VC is directed to AI/ML.
OpenAI seeks a $500B valuation despite projected $100B losses over 5 years. Oracle’s market cap spiked $240B in a day on a $300B OpenAI deal — despite OpenAI’s limited $12B revenue and no cash flow visibility.
Market concentration is unprecedented. Nvidia is now 8% of the S&P 500 (worth 15% of US GDP). The Mag-7 have grown from 18% to 32% of the index since ChatGPT’s launch, while the top 10 stocks control 40% of market cap and 25% of earnings.
Returns are skewed. Since Jan ’21, 55% of S&P gains came from just the top 10 stocks. Since Apr ’25, the Mag-7 are up 50%, while the other 493 stocks rose only 20%.
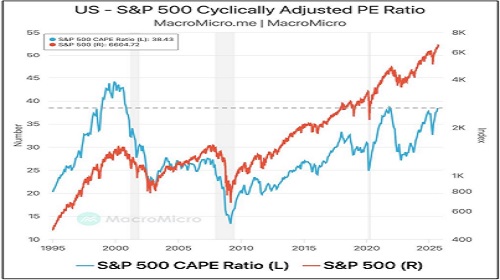
Valuations are stretched. The Shiller P/E at 38.4 is approaching dotcom bubble levels. With AI-driven concentration in capex, earnings, and market cap already surpassing 2000 peaks, risks of a bubble are extreme, even if AI is transformative.
Low US Consumer confidence could weigh on US Mega Caps
* US Consumer sentiment below GFC 2008 levels is troubling in its own right, but what makes it particularly more troubling is that historically, US consumer sentiment has tracked quite closely over time with US equity indices.
* Evidence of a squeezed middle class is mounting. Several CEOs across the dining, retail, fashion and airline industries have said their middle-class customers are increasingly strapped, even as high earners keep on buying.
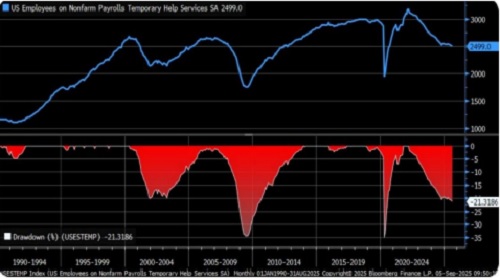
* Temp help is almost always fired first when the economy slows, and the drawdown is now worse than the early 2000s recession.
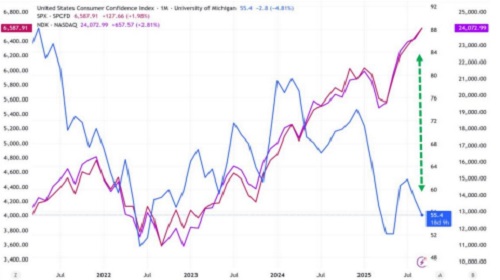
* A key way US policymakers have been able to convince the public that both “all is well with the economy” and that “the US is winning v. China” is by pointing to US stocks – this divergence above suggests the public is beginning to doubt US policymakers’ “confidence game”.
* The US equity market has been the key marginal driver of US consumer spending and, therefore, US GDP and Federal tax receipts. If anything happens to US stocks, it will quickly manifest in a recession with rapidly rising UST yields, which will then have to be met with more USD liquidity or some form of Yield Curve Control.
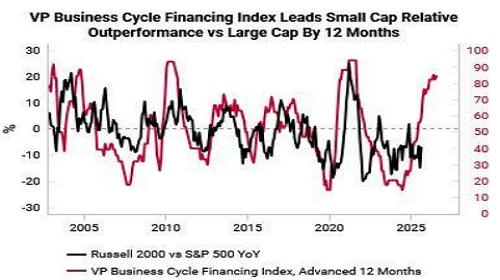
If the AI Bubble Doesn’t Burst, Could Small-Caps Be the Next Big Story
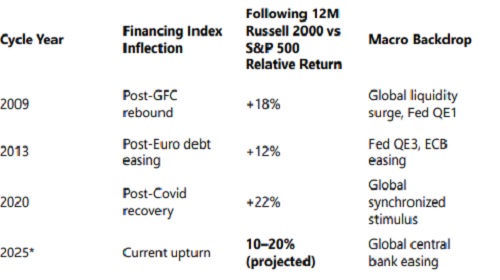
The VP Business Cycle Financing Index (red line in the chart) has historically led the Russell 2000's relative performance compared to the S&P 500 (black line) by nearly 12 months, providing a reliable signal for small-cap cycles.
* Turning points in the Financing Index have consistently preceded inflections in small-cap relative returns.
* During past easing phases (2009, 2013, 2020), small caps delivered 10–20% relative outperformance over the following 12–18 months.
* The index is again trending sharply higher, implying a favorable setup into 2025–26.
As global central banks ease in sync, reflationary conditions are forming a supportive backdrop for small caps. The coming year may provide a strong relative performance window, where active selection can capture upside while avoiding crowding and balance sheet vulnerabilities.
Above views are of the author and not of the website kindly read disclaimer