Public Sector Banks Lead Business Growth in Q1FY26 by CareEdge Ratings
Synopsis
* Scheduled Commercial Banks’ (SCBs) credit offtake rose 9.9% year-on-year (y-o-y) in Q1FY26. In absolute terms, credit expanded by Rs 16.5 lakh crore over the last 12 months, slower than the Rs 26.45 lakh crore seen in the same period last year. The growth was driven primarily by increases in the housing, gold loans, and vehicle finance segments. Additionally, this growth was further supported by credit expansion in the MSMEs segment, which grew at 19.3% in Q1FY26, which was partly offset by a moderation in agriculture (6.8%), industry (5.5%), services (9.6%), and slower expansion in personal loans (12.1%).
* The credit offtake of public sector banks (PSBs) has continued to outpace private sector banks (PVBs) since the last three quarters, as PSBs had greater headroom for lending with stable credit-to-deposit (CD) ratios as compared to PVBs.
* The North-eastern region, with a y-o-y growth of 13.7%, outperformed other regions. Meanwhile, the rural segment grew the fastest among all the regions at 12.8%.
* In June 2025, credit outstanding rose to Rs 33.1 lakh crore in the 7–8% interest rate bracket, increasing from Rs 20.0 lakh crore in June 2024. Lower rate brackets (11%) declined to Rs 27.0 lakh crore from Rs 30.3 lakh crore, indicating that banks are increasingly favouring mid-yield loans while reducing their exposure to high-interest lending.
* Deposits witnessed a faster growth compared to credit, with a y-o-y growth at 10.9%, driven by stronger mobilisation efforts by private banks and competitive deposit rates on select products. In absolute terms, deposits expanded by Rs 22.6 lakh crore from June 2025.
* The growth for term deposits stood at 13.1% y-o-y in Q1FY26, lower than the 17.4% rate in Q1FY25. Meanwhile, CASA saw a growth of 7.6% y-o-y compared to 5.7% in Q1FY25.
* The metropolitan region saw the highest growth, at 11.7%, amongst all regions in Q1FY26.
* In June 2025, domestic term deposits remained concentrated mainly in the 7–8% interest bracket at Rs 8.5 lakh crore, up from Rs 6.7 lakh crore.
* The Credit to Deposit (CD) ratio declined by 78 bps y-o-y by the end of June 2025 and reached 79.6% compared to 80.4% over a year ago, with the deposit growth rate outpacing that of credit offtake. Furthermore, the gap between the two has narrowed compared to the previous year, supported by improved liquidity conditions following the RBI's rate cuts.
SCBs Deposit Growth Outpaces Credit Offtake
Figure 1: Share in Total Deposits and Credit (%)
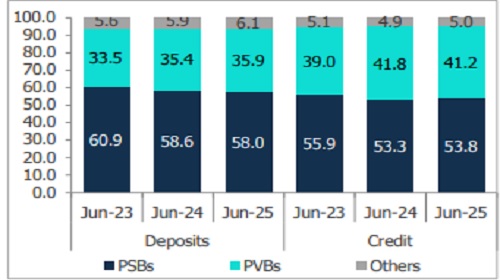
Figure 2: SCBs Growth Trend (y-o-y, %)
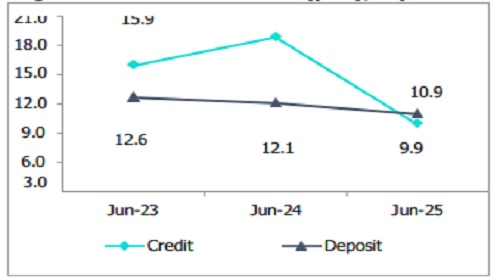
* As of June 30, 2025, credit outstanding touched Rs 183.4 lakh crore, registering a growth of 9.9% y-o-y compared to 18.8% (includes merger impact) in Q1FY25. As of June 2025, PSBs have gained market share in total credit, accounting for 53.8%, compared to 41.2% held by PVBs. This increase in PSBs' share comes amid stable CD ratios for PSBs as compared to PVBs, which enabled greater lending headroom in the current quarter. The slowdown in overall credit offtake was primarily driven by a slowdown in the growth of NBFCs, wherein credit growth to the NBFC segment dropped sharply from 8.5% in Q1FY25 to 2.6% in Q1FY26. Additionally, credit growth in the services and personal loan segments declined significantly, decelerating to 9.0% and 12.1% in Q1FY26 from 17.4% and 25.6%, respectively, a year earlier.
* As of June 30, 2025, outstanding deposits totalled Rs 230.1 lakh crore, reflecting a y-o-y growth of 10.9% wherein term deposits experienced an increase of 13.1%, significantly outpacing CASA's growth rate of 7.6% Meanwhile, PVBs achieved a double-digit growth of 12.1% outpacing PSBs, which grew at a single-digit growth of 9.8%.
Analysis of Credit
Figure 3: Bank group-wise outstanding credit
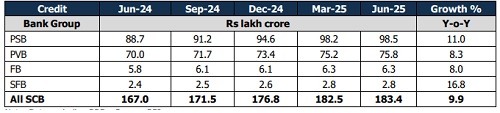
* PSBs have gained market share by 55 bps y-o-y, reaching 53.8% in Q1FY26 outpacing PVBs in credit growth during Q1FY26, which reduced their market share by 58 bps y-o-y. This outperformance of PSBs could be attributed to the stable CD ratios of PSBs compared to PVBs, which enabled them to have greater lending headroom. Additionally, PSBs have strengthened their position in the Retail, agriculture and the MSME segments. PVBs also posted growth, albeit at a slower pace, partly due to tighter disbursements in unsecured retail segments (like personal loans and credit cards), leading to a decline in their relative market share.
* PSBs reported a rise of 11.0% compared to 14.3% over the same period last year. In absolute terms, credit expanded by Rs 9.8 lakh crore to Rs 98.5 lakh crore in Q1FY26. The State Bank of India (SBI), the country’s largest lender, continues to hold approximately 23% of the total credit in Q1FY26, with a loan book of Rs 42.55 lakh crores.
* PVBs reported a slower growth as compared to PSBs, reaching 8.3% y-o-y in Q1FY26, moderating from 27.7% in the previous year, which was elevated due to merger-related base effects. The credit growth in PVBs is primarily driven by strong demand for MSME loans and growth in the vehicle finance segment. In absolute terms, PVBs’ credit expanded by Rs 5.8 lakh crore, reaching Rs 75.8 lakh crore.
Region
Figure 4: Region-wise Outstanding Credit

* In terms of regional performance, the North-Eastern region continued to report the highest growth at 13.7% y-o-y, reaching Rs 2.1 lakh crore, followed by the Central, Eastern and Western regions, which benefited from MSME support. The Northern region recorded the lowest growth at 7.2%, resulting in a decline in its market share, as banks remained cautious amid elevated slippages in the MFI and unsecured segments. Additionally, lower borrowings by major corporates have contributed to this slowdown in the Northern region. However, in absolute terms, the region registered the highest credit expansion of Rs 5.8 lakh crore.
Figure 5: Regional Market Share Trend (%) – Western Region Continues to Dominate
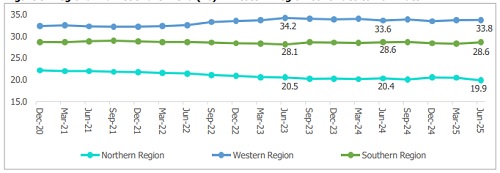
The Western region continues to hold the largest share at 33.8% as of June 30, 2025. However, growth in the current quarter grew marginally, with the region’s market share rising by about 20 bps y-o-y. This was supported by its strong economic base, with Mumbai and other industrial hubs driving higher credit demand. Additionally, higher per capita income continues to support sustained growth in the region’s share.
Population
Figure 6: Population Group-Wise Outstanding Credit
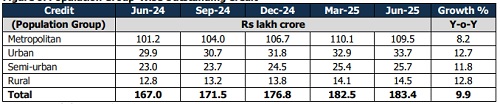
* The urban segment reported the highest increase in market share, rising by 47 bps to 18.4% in Q1FY26, followed by the semi-urban segment, which grew by 24 bps to 14.0%. Meanwhile, the rural segment (which grew the fastest among all the regions) also increased by 21 bps to 7.9%. In contrast, the metropolitan segment (holding the largest market share of 59.3%) lost market share by 92 bps, primarily due to a slowdown in low-yield corporate lending and a slowdown in the NBFC segment. In contrast, semi-urban and urban areas saw growth higher than metropolitan regions, mainly supported by MSME demand and local capex.
Figure 7: Movement in Interest Rate Buckets for Advances (In %)
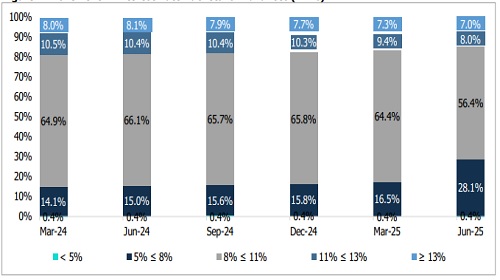
* Lending in the 5%–8% bucket surged to 28.1% by June 2025 (from 15.0% in June 2024), indicating a strong shift towards mid-range pricing. The 8%–11% segment, although still dominant, declined to 56.4% from 66.1% the previous year. Higher-cost lending (11%–13% and ≥13%) also saw a gradual dip in share, while loans priced below 5% remained negligible at 0.4%.
* Sequentially, the 7%-8% interest rate bucket witnessed a jump to 18.4%%, attributed to a repricing effect due to impacts from the rate cut transmission, a shift in loan mix toward retail/MSME, and rising marginal cost of funds due to higher deposit rates and improved liquidity conditions.
Above views are of the author and not of the website kindly read disclaimer