Nifty Opened with a downward gap however buying support at lower levels pulled the index to end on a positive note - Axis Securities

Follow us Now on Telegram ! Get daily 10 - 12 important updates on Business, Finance and Investment. Join our Telegram Channel
Nifty
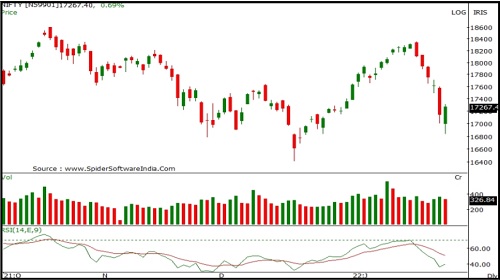
Nifty opened sharply lower with a downward gap and extended selling momentum in the first half however buying momentum at lower levels erased earlier losses to close in green. Nifty closed at 17278 with a gain of 129 points. On the daily chart the index has formed a Bullish candle with a long lower shadow indicating buying at lower levels. The index continues to move in a Lower Top and Lower Bottom formation on the hourly chart indicating negative bias. The chart pattern suggests that if Nifty crosses and sustains above 17300 level it would witness buying which would lead the index towards 17400-17500 levels. However if the index breaks below 17200 level it would witness selling which would take the index towards 17100-17000. Nifty is trading below 20, 50 day SMA indicating negative bias in the short to medium term. Nifty continues to remain in an uptrend for the short term, so buying on dips continues to be our preferred strategy. The daily strength indicator RSI is moving downwards and is quoting below its reference line indicating negative bias.
The trend deciding level for the day is 17140. If NIFTY trades above this level then we may witness a further rally up to 17445-17615-17920 levels. However, if NIFTY trades below 17140 levels then we may see some profit booking initiating in the market, which may correct up to 16975-16670-16500 levels.
Banknifty
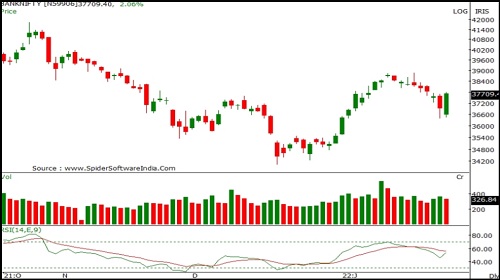
Banknifty opened with a downward gap however buying support at lower levels pulled the index to end on a positive note. Banknifty closed at 37707 with a gain of 759 points.
On the daily chart index has formed a bullish candle and has closed above its previous session's high representing positive bias ahead. The index is moving in a Higher Top and Higher Bottom formation on the daily chart indicating a short term up trend. The chart pattern suggests that if Banknifty crosses and sustains above 37800 levels it would witness buying which would lead the index towards 38000-38300 levels. However if index breaks below 37500 level it would witness selling which would take the index towards 37400-37200. Banknifty is trading above 20 and 50 day SMA indicating positive bias in the short to medium term. Banknifty continues to remain in an uptrend in the long term, so accumulation on dips and near major support zones continues to be our preferred strategy. The daily strength indicator RSI is moving downwards and is quoting below its reference line indicating negative bias.
The trend deciding level for the day is 37305. If BANK NIFTY trades above this level then we may witness a further rally up to 38190-38675-39565 levels. However, if BANK NIFTY trades below 37305 levels then we may see some profit booking initiating in the market, which may correct up to 36820-35930-35445 levels.
To Read Complete Report & Disclaimer Click Here
For More Axis Securities Disclaimer https://simplehai.axisdirect.in/disclaimer-home
SEBI Registration number is INZ000161633
Views express by all participants are for information & academic purpose only. Kindly read disclaimer before referring below views. Click Here For Disclaimer


More News

Perspective on How will the market look like by Diwali 2022? By Mr. Mohit Ralhan, TIW PE