


Nifty Slumps Below 23,000 as Selling Intensifies - ICICI Direct Ltd

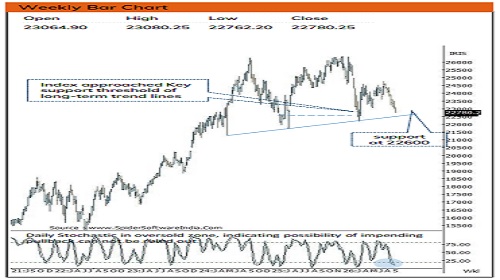
Nifty : 22780
Technical Outlook
Day that was ..
The equity benchmark extended its corrective phase as a surge in US 10-year treasury yields and fluctuating crude oil prices dented the market sentiment. The Nifty 50 faced relentless selling pressure throughout the session, ultimately settling at 22,780, down 360 points (1.6%). Sectorally, IT and Consumer Durables relatively outperformed the broader markets but still closed the day in negative territory. The primary laggards dragging down the performance were PSU Banks, Realty, and Oil & Gas.
Technical Outlook :
• The index witnessed a gap down opening and slid relentlessly southward, offering no signs of brief recovery throughout the session. Consequently, this persistent selling pressure resulted in a sizable bearish candle that dragged Nifty below its immediate psychological benchmark of 23,000 probing an intraday low of 22,762.20. Compounding the damage, a steep drop in Nifty Bank heavily weighed down the headline index due to its high sectoral weightage.
• With past seven weeks 7% correction, index has now entered a critical zone near the long-term rising trendline originating from the June 4, 2024 low (Election Day panic bottom) continues to act as a vital floor during previous corrections (placed at 22,600). Going ahead, arresting the slide near the 22,700-22,600 zone would provide structural cushion where this multi-year rising trendline cluster aligns with 80% retracement of Apr-Aug rally (22182-24774) that is essential to prevent a deeper breakdown amid oversold conditions.
• The current seven-week correction aligns with historical patterns. Past two decades data reveals that there have been only five instances where the Nifty experienced a correction lasting more than six consecutive weeks, with the maximum duration being seven weeks during the 2008 and 2020 market cycles. In all such cases, momentum oscillators bounced after approaching their bearish extremes, offering medium-term buying opportunities.
• Despite the continuous price decline, daily momentum oscillators are flashing early signs of selling exhaustion. A prominent positive RSI divergence has surfaced on the daily chart, marked by the Relative Strength Index printing distinctive higher lows while the price index registered lower lows. This technical divergence underscores an underlying bullish shift in momentum. Concurrently, with the weekly Stochastic oscillator locked deep within historical oversold terrain (~9), the highly stretched downside setup suggests that traders should refrain from creating aggressive short positions.
• Mirroring the benchmark move, broader market seen profit booking. However, it is important to highlight is that, with recent correction short term market breadth appears to be approaching its cyclical. Currently, 80% of stocks within Nifty 500 universe are trading below their 50 days SMA. Historically such a low reading has offered incremental buying opportunity in quality stocks backed by strong earnings.
Key Monitorable :
1. U.S. GDP Data
2. Crude Oil & Inflation Expectations
3. Monthly Auto Sales Data
Intraday Rational :
Trend – Lower high lower low indicate corrective bias
Levels – Sell around 61,8% retracement of Mondays decline.
Nifty Bank : 54472
Technical Outlook
Day that was :
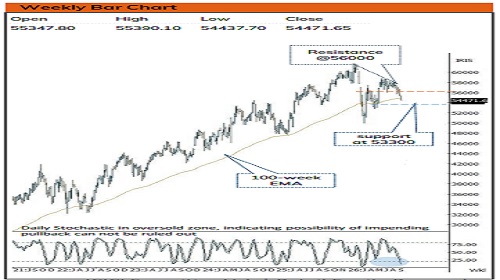
Bank Nifty ended the day on negative note, at 54472 down 1.99% on back of weak market sentiments and global uncertainties.
Technical Outlook :
• Bank Nifty started the week with gap-down opening and remained southwards throughout the day and closed near low point of the day. The daily price action formed is a long bear candle with lower high lower low indicating extended correction.
• The lack of follow through strength above previous session high clearly signifies near term weakness. Thereby a decisive close above previous session high (55390) would be a prerequisite to pause the ongoing corrective move. Failure to do so would result into extended correction wherein strong support is placed around crucial support area of 53300 levels being 61.80% retracement of Apr-Jun rally (49955-58706).
• On the upside, a sustained move above 55,300–55,400 could strengthen the recovery momentum and open the way toward 56000 being 61.8% retracement of current decline(56996-54437).
• The PSU Bank Index formed sizable bear candle breaching July lows indicating extended correction. Going ahead, support is placed at the lower band of past five months consolidation (9095-7809). While oversold placement of daily and weekly stochastic oscillator warrant for selling exhaustion in coming weeks.
• Intraday Rational :
• Trend - Lower high lower low indicate corrective bias.
• Levels: Sell around 61,8% retracement of Mondays decline.
Please refer disclaimer at https://secure.icicidirect.com/Content/StaticData/Disclaimer.html
SEBI Registration number INZ000183631











.jpg)