
Nifty Rebounds From Intraday Low, Forms Bullish Candle After Four-Day Decline - ICICI Direct

Nifty : 22753
Technical Outlook
Day that was ..
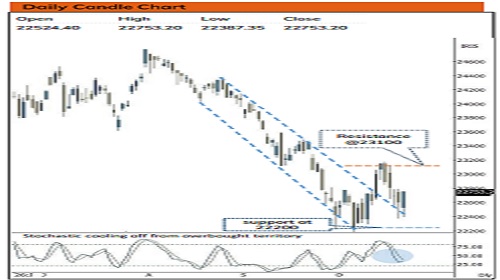
The Nifty 50 witnessed a pause in its corrective phase on Monday, recovering from intraday lows after four consecutive sessions of decline. Buying interest emerged around lower levels, helping the index recover and close at 22,753, up around 153 points. Sectorally, Metals and Healthcare outperformed the broader markets and closed the day in positive territory. Meanwhile, Consumer Durables was the primary laggard.
Technical Outlook :
• After four consecutive sessions of decline, the index recovered from its intraday low near 22,388, forming a bullish candle with a relatively long lower wick. This indicates buying interest at lower levels and a potential pause in the corrective phase, although follow-through buying will be essential to confirm a sustained reversal.
• The index is retesting the breakout area of its two-month falling trendline following the recent pullback. The ability to attract buying interest around 22200-22400 will be crucial. Further, a decisive close above Friday’s high (22787) would confirm pause in corrective phase that would open the door for pullback towards upper band of past four week’s consolidation placed at 23100
• Going ahead, we expect that volatility will remain elevated as geopolitical tensions escalate and crude oil prices rise ahead of the US Midterm elections. Since August, we have seen multiple failed pullback attempts. Therefore, we believe, for a meaningful pullback to materialise, index need to decisively close above 23500 mark which is 50% retracement of current decline (24774-22180) that coincides with downward sloping trend line. Otherwise, the corrective bias is likely to continue, with strong support being placed at 22200-21700 zone as it is 61.8% retracement of Oct-23 to Sep-24 rally (18838-26277) coincided with Apr-26 low.
• Structurally, Despite the ongoing global volatility, the Nifty managed to hold its ground above the long-term 200-week EMA. Historical data spanning the past 25 years reveal that, the median correction following breach of this key average has been limited to 3% (barring 2001, 2008, 2020). Buying during such panic periods has historically resulted in 10% returns in subsequent 3-6 months.
• Past 25 years, there have been eight instances where bull market corrections were arrested, with an average correction of 17%. Given that approximately 16% of the corrections have already occurred since Jan-26 high 26373, the market appears to be approaching its price-wise maturity.
• Historically, these deep oversold conditions have served as optimal entry points for constructing medium-to-long-term portfolios. Consequently, any tangible signs of geopolitical de-escalation or a cooling of crude oil prices will likely act as key catalysts to revive broader market momentum
Key Monitorables
• US Fed meet
• Crude Oil & US 10 Year Bond yields
Intraday Rational :
Trend – Extended breather helped index to retest two months falling channel
Levels – Buy around 61.8% retracement of Monday range
Nifty Bank : 54320
Technical Outlook
Day that was :
Bank Nifty ended the day on flat note at 54320 on back of mixed global cues. However, the Nifty Private Bank relatively outperformed for the day gaining 0.6% for the day.
Technical Outlook :
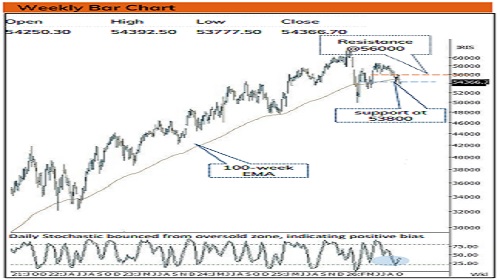
• The index started the week on negative note. However, supportive efforts from September lows around 53800 levels which helped Index to recover losses and settle above 54300 levels. The daily price action formed is bullish hammer like candle, indicating supportive efforts from lower levels.
• Going ahead volatility is likely to remain elevated on back of Monthly expiry and ahead of US Fed meet outcome. A decisive close above previous session high(54392) will be a prerequisite to pause the ongoing corrective phase. Current breather is seen as a healthy retracement as Index has retraced only 61.8% of current 6 days up move (54383- 56065).
• Structurally, Index bias remains corrective as long as it forms lower high lower low formation on the weekly chart. Only a decisive close above to weeks identical high of 56000 would open door for extension of move. Else prolongation of consolidation in 56000-53800 zone
• NiftyPSU Bank Index has formed small bull candle with lower shadow ,closed below 52-week ema with support placed around 7800-7860.
Intraday Rational :
• Trend - Supportive efforts from September lows
• Levels: Buy around Mondays low
Please refer disclaimer at https://secure.icicidirect.com/Content/StaticData/Disclaimer.html
SEBI Registration number INZ000183631