Nifty Near 23,000, Corrective Bias Persists - ICICI Direct Ltd

Nifty : 23140
Technical Outlook
Week that was ..
Global market sentiment was under pressure this week, driven by a sharp rise in U.S. 10-Year Treasury yields and a surge in crude oil prices. As a result, the Nifty concluded the week with its seventh consecutive weekly decline, settling at 23,140, down 0.9% from the previous close. The broader market also reflected profit-taking pressure, with midcap indices declining by 2%, while small-cap indices slipped by 0.9%. Sectorally, the realty, pharmaceuticals sectors demonstrated relative resilience. In contrast, the IT and financials sectors continued to face headwinds, contributing to the overall negative momentum
Technical Outlook :
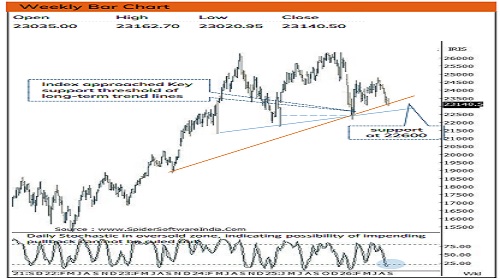
• The index drifted downward and approached near June low near psychological mark of 23000. As a result, weekly price action formed a bear candle carrying lower high-low, indicating prolonged corrective bias.
• In the coming truncated week, we advise traders to exercise caution approach and avoid aggressive short positions at current levels. The market appears to be in a phase of selling exhaustion, and any decisive close above the previous week’s high (around 23,500) could signal the beginning of a meaningful rebound.
• With past seven weeks 7% correction, index has now entered a critical zone near the long-term rising trendline that has historically acted as a floor during previous corrections (placed at 22,600). This level, combined with the extended duration of the recent decline, points toward a potential shift in market dynamics.
• The current seven-week correction aligns with historical patterns. Past two decades data reveals that there have been only five instances where the Nifty experienced a correction lasting more than six consecutive weeks, with the maximum duration being seven weeks during the 2008 and 2020 market cycles. In all such cases, momentum oscillators bounced after approaching their bearish extremes, offering medium-term buying opportunities.
• Given that the current correction has now reached the seven-week mark that hauled weekly stochastic in oversold territory (at 13) while witnessing positive divergence on the daily chart, suggesting impending pause or a potential reversal, especially if external catalysts, such as a de-escalation in geopolitical tensions help stabilize crude oil prices, providing a tailwind for Indian equities.
• While the benchmark index has been under pressure, the broader market has shown signs of healthy consolidation amid stock specific action. This corrective phase offers a potential window for fresh entry opportunities, particularly for investors with a medium-term investment horizon.
Key Monitorable :
1. U.S. GDP Data
2. Index of Industrial Production (IIP)
3. Monthly Auto Sales Data
Intraday Rational :
• Trend – Highly volatile rangebound structure with a cautious positive bias above 23,300.
• Levels – Buy around Fridays low
Nifty Bank : 55580
Technical Outlook
Week that was :
Bank Nifty ended the week on negative note, at 55580 down 1.38% on back IRDA news developments .
Technical Outlook :
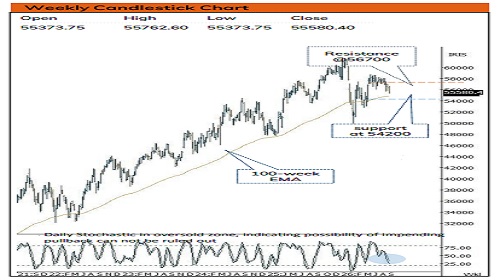
• Bank Nifty closed at 55,580 levels on 25 September, and the outlook for coming week remains cautiously balanced. The immediate trading range to watch is 55,300–56,000, with the index likely to seek direction from either side of this zone.
• Index breached last two weeks low around 55700 and formed lower high lower low indicating weakness. Bias remains corrective as long as it closes above previous session high.
• On the upside, a sustained move above 55,800–56,000 could strengthen the recovery momentum and open the way toward 56700 being placement of 200 days EMA. However, a move above these levels should ideally be supported by strong price action and participation from major banking constituents
• On the downside, 55,300 is an important near-term support area. If Bank Nifty sustains below this level, selling pressure could increase. Support placed around 54200 levels a crucial support area. This zone aligns with the 80% retracement level of the June rally, spanning from 53,027 to 58,706.
• The PSU Bank Index formed small doji candle at 52- week EMA indicating buying demand.Going ahead, holding 8150 will lead to pullback towards 8600 levels being 61.8% retracement of current decline.
Intraday Rational :
• Trend - Prolongation of consolidation around 52 weeks EMA
• Levels: Buy around Fridays low
Please refer disclaimer at https://secure.icicidirect.com/Content/StaticData/Disclaimer.html
SEBI Registration number INZ000183631