Nifty Holds 200-Week EMA Amid Volatility - ICICI Direct Ltd

Nifty : 22520
Technical Outlook
Week that was ..
The equity benchmark staged rebound in the fag end of the week, snapping an eight-week losing streak and concluding the volatile week at 22,520, marking a modest gain of 0.45%. Broader market seen rebound mirroring the benchmark move, small cap gained 0. 5% over the week. Sectorally, the financial sector surged, post the RBI’s policy outcome coupled with IT, which witnessed a notable rebound, driven by the earnings kickoff from TCS. Conversely, cyclicals such as metals, realty, and automobiles continued to face pressure, undergoingextended periods of correction
Technical Outlook :
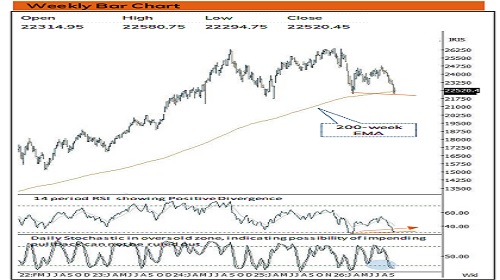
• Index started the session on a subdued note and continued to drift The index ended the week on a flat to positive note, while sailing through volatility influenced by escalating geopolitical tensions, surging crude oil prices, and rising U.S. 10-year bond yields. However, the long-term 200-weeks EMA provided crucial support, helping the index regain some of its lost ground. Consequently, weekly price action formed a Doji like candle.
• Following an unprecedented eight-week corrective phase since 2001, the index has paused its decline and established key structural support. During this pullback, prices successfully defended the longterm 200-week EMA coupled with long term rising trend line.
• The emergence of a Doji-like candlestick right at this crucial confluence, coupled with weekly momentum oscillators reaching deeply oversold territory (as weekly stochastic recorded bullish crossover at 13 levels) signals early sign of selling exhaustion. Positive divergence on the weekly RSI further supports this view.
• Going ahead, closing above the Doji candle high of 22,800 on weekly basis could signal a potential reversal and pave the way for a pullback toward 23,500 in coming weeks. Failure to do so would result into continuation of corrective bias wherein strong support is placed at the April 25 low of around 21,700.
• Moreover, with the 10% correction seen over the past nine weeks, Nifty approached the April 26 low of 22182. Meanwhile, the Next 50 Index remains 13% above the April lows, highlighting relative strength. This suggests that during the next phase of rally, these higher-quality stocks are likely to lead the charge.
• Additionally, the percentage of Nifty 500 stocks trading above their 50- day EMAs has reached bearish extremes, indicating a stretched market poised for a sharp technical pullback when global macroeconomic conditions stabilize.
Key Monitorables
• US & India Inflation print
• Crude Oil
• US 10 Year Treasury Yields
Intraday Rational :
Trend – Lower high lower low indicates corrective bias.
Levels – Buy around 61.8% retracement of Fridays range
Nifty Bank : 55256
Technical Outlook
Week that was :
Bank Nifty ended the week on positive note, at 55256 up 1.48% on back of mixed global cues.
Technical Outlook :
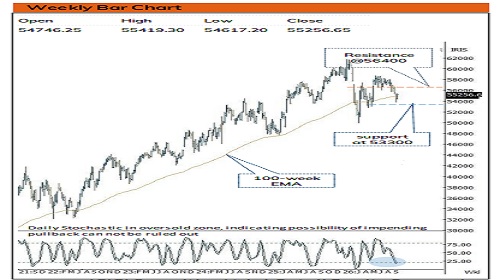
• Bank Nifty started the week with positive opening and inched northward towards last week high around 55400 and close bit lower around 55256. The weekly price action formed is bull candle with higher high higher low indicating positive bias.
• Index has formed higher high higher low after 4 weeks decline. Going ahead follow through strength beyond 55400 (Two weeks high) would confirm resumption of uptrend and open door towards 56400-56600 levels being 61.8% retracement of current decline(58025- 53785) and 200-day EMA.
• However, failure to do so would result into extended correction wherein strong support is placed around crucial support area of 53300 levels being 61.80% retracement of Apr-Jun rally (49955-58706).
• Among oscillators, weekly stochastics is placed at 22 levels rebounding from oversold territory indicating impending pullback.
• The PSU Bank Index formed bear candle with upper shadow indicating breather. Going ahead, support is placed at the lower band of past five months consolidation (9095-7809). While oversold placement of daily and weekly stochastic oscillator warrant for selling exhaustion in coming weeks.
Intraday Rational :
• Trend - Lower high lower low indicates corrective bias.
• Levels: Buy around 61.8% retracement of Fridays range
Please refer disclaimer at https://secure.icicidirect.com/Content/StaticData/Disclaimer.html
SEBI Registration number INZ000183631













Tag News
Perspective on the Gold & bullion industry by Darshan Desai, CEO, Aspect Bullion & Refinery