Nifty has established a higher base after reclaiming its 200-day EMA - ICICI Direct

Nifty : 24570
Technical Outlook
Week that was ..
Equity benchmark extended gains over second consecutive week, brushing off the geopolitical noise to settle the week at 24570, up 0.75%. Broader market outshone wherein Smallcap remained in limelight as it reclaimed new highs of 20 months, up 2.6%. On the sectoral front we are witnessing rotation as PSU Banks, Defence and Metal regained momentum after couple of months breather while recent outperforming themes like capital market and realty took a breather.
Technical Outlook :
• Nifty started the week with a positive gap up and oscillated within a narrow ~340 points range throughout the week. As a result, the weekly price action has resulted into “Doji-like candle”, indicating breather after recent sharp up move.
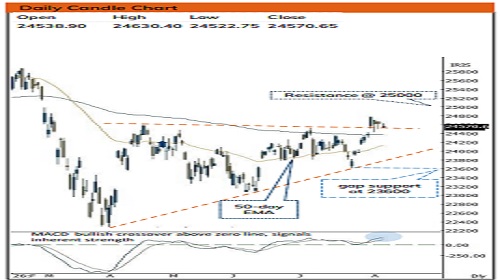
• Nifty has established a higher base after reclaiming its 200-day EMA. As a result, index has been hovering around the breakout area of past four months consolidation (placed at 24600).
• The formation of higher peak and trough along with ongoing sector rotation signifies broadening of rally that bodes well for eventual breakout from consolidation and open the door for milestone of 25100 in coming weeks. Eventually, we expect Nifty to extend this move and head towards 25500 in coming months. Our positive bias remains intact as long as key support threshold of 23600 is held
Our constructive stance is based on following observations :
I. Over past three decades there have been 8 occasions where Nifty has remained below its 200 days EMA for at least four months. The subsequent move, after reclaiming its 200 days EMA has been noteworthy as it delivered average returns of 12% to 19% over the next 3 to 6 months. In the current scenario, the index has reclaimed its 200-day EMA after four months consolidation, History strongly favours the bull
II. Following the Midcap move, Nifty smallcap index reclaimed its alltime high after 20 Months. The breakout from 8 years falling trend line on the ratio chart of Nifty smallcap / Nifty augurs well for acceleration of upward momentum
III. The index is at the cusp of 4 months consolidation breakout. But this breakout looks imminent as market breadth has seen significant improvement since then. Currently 56% of stocks of Nifty 500 universe are trading above their 200 days SMA compared to April swing high of 41%
IV. dAfter 13 months relentless FII’s outflow, selling pressure is finally waning. FII’s turned into a net buyer worth Rs. 2400 cr. To kick start the August month
Key Monitorable :
a) US and India Inflation Print
b) Positive development on Geopolitical front
c) Falling crude oil prices
Intraday Rational :
• Trend – Formation of higher high-low structure in daily tim
Nifty Bank : 57746
Technical Outlook
Week that was :
Bank Nifty ended the volatile week on positive note up 0.8% at 57746 on back of mixed global cues.
Te chnical Outlook :
• Index started the week with gap-up opening (57465- 57411) gap area and there after traded in Mondays bull candle range indicating consolidation. As a result, the weekly price action has resulted into bull candle with higher high higher low, indicating positive bias.
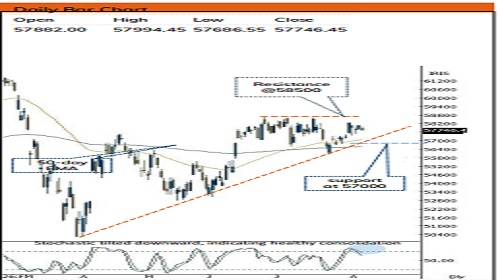
• Index found supportive efforts from 20-day EMA around 57500 levels and now resumed uptrend after 2 days breather indicating positive momentum.Going ahead we expect, index to resolve out of one month consolidation range where upper band is placed at 58500 and open the door for next leg of up move towards 60000. The key support zone of 57000 is a placement of the 50-day EMA coinciding with 50% retracement of recent rally (56024- 58248) and four months rising trend line
• Another observation is that over last 6 weeks Index has retraced by 38.2% of earlier 3 weeks rally, indicating slower pace of retracement which would help to set stage for next leg of rally.
• The PSU Bank Index relatively outperformed and witnessed breakout from 6-week consolidation range after higher base above 52- week EMA. Going ahead follow through strength above last week week(8870) high would set the stage towards 9100 levels
Intraday Rational :
• Trend - Supportive efforts emerged from the lower band of the contracting triangle
• Levels: Buy around 80% retracement of last 4 days range
Please refer disclaimer at https://secure.icicidirect.com/Content/StaticData/Disclaimer.html
SEBI Registration number INZ000183631