Nifty Forms Inside Bar Pattern on Daily Chart - ICICI Direct Ltd

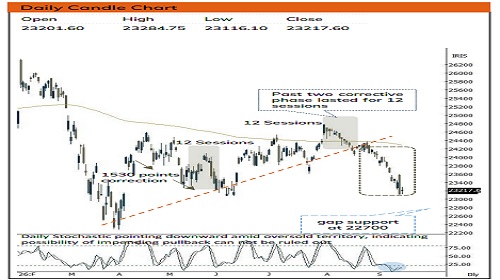
Nifty : 23218
Technical Outlook
Day that was ..
The equity benchmark successfully arrested its recent steep decline, staging an oversold relief bounce to settle in the green. Notably, the frontline Nifty 50 index exhibited relative resilience, outperforming the broader markets during the session. Sectorally, defensive buying and selective demand helped FMCG and Auto emerge as the top-performing sectors of the day, providing a vital cushion to the tape. On the flip side, Metals and Realty continued to lag,.
Technical Outlook :
• On The daily timeframe, the index formed a classic Inside Bar candlestick pattern, with price action strictly confined within the previous session's high-low range. The successful defense of the identical low at 23,115 established an intraday double bottom, indicating a temporary exhaustion of selling pressure.
• The structural defense in the benchmark is heavily supported by the action in the broader markets. As explicitly seen today, the bounce back from the 100-day EMA for smallcaps and the 200-day EMA for midcaps, culminating in their respective hammer-like daily candles, highlights underlying demand. Coupled with deeply oversold momentum oscillators, this setup indicates a near-term cooling of the recent aggressive supply pressure, allowing the index to attempt a consolidation of its base.
• Going forward a higher high, higher low structure above Wednesday's intraday high is required to validate a pause in the current decline and open up a sustainable pullback rally toward the 23,350 to 23,450 .Conversely, if the major support base at 23,115 is violated on a closing basis, this relief bounce will be invalidated, paving the way for an extended capitulation flush directly toward the 22,700 macro Fibonacci floor
• Key Monitorable :
1. Geopolitical Developments
2. Cool off in Crude Oil
Intraday Rational :
• Trend – An oversold relief bounce signaling a potential pause, though the broader setup remains constrained until Wednesday's intraday high is decisively breached.
• Levels – Buy around June lows
Nifty Bank : 56292
Technical Outlook
Day that was :
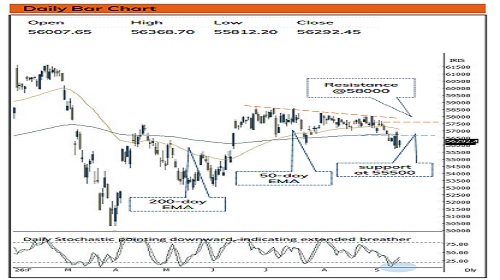
Bank Nifty ended the day on positive note, at 56292 up 0.9% on back of mixed global cues.
Technical Outlook :
• Index started the day with positive opening then rebounded after taking support near previous session low and formed higher high higher low throughout the day as intraday pullback were brought into. The daily price action formed a bull candle inside previous days candle, indicating pause in corrective phase.
• On expected lines Index rebounded from oversold conditions ahead of Fed meet outcome. Index found supportive efforts emerging from 55700-55800 support zone being 50% retracement of May-June rally (52783- 58706). Meanwhile, a decisive close above the previous session high of 56368 is required, which has remained elusive for the past six sessions to confirm a sustained recovery and open the door for a potential pullback towards 57100 being 61.8% retracement of current decline(58025-55700).
• Sustainability below the same would result into extension of corrective bias towards 55500, representing a 38% retracement of the April–June rally (46,935–58,706).Stochastic oscillator is in rising trajectory place at 35 levels.
• The PSU Bank Index formed also formed Inside day candle closing at its 52-week EMA. Going ahead, holding 8150 will lead to pullback towards 8600 levels being 61.8% retracement of current decline.
• Intraday Rational :
• Trend - Prolongation of consolidation around 52 weeks EMA
• Levels: Buy around 12th June lows.
Please refer disclaimer at https://secure.icicidirect.com/Content/StaticData/Disclaimer.html
SEBI Registration number INZ000183631