
Nifty Forms High-Wave Candle Amid Volatility - ICICI Direct

Nifty : 22750
Technical Outlook
Day that was ..
The Nifty concluded monthly expiry session on a flat note at 22,750. However, the broader markets significantly outperformed the benchmark today, with the SmallCap index surging around 2.5% and the MidCap index up around 1%. Sectoral performance remained mixed; Pharma, Realty led the gains, while IT took a breather
Technical Outlook :
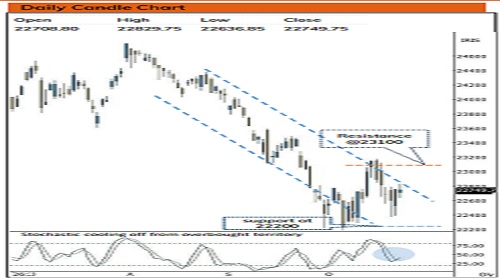
• Amidst volatility, the index failed to cross the previous three session's high on a closing basis. Consequently, index has taken a shape of a high wave candle, indicating breather.
• Index is likely to witness gap down opening amid escalated geopolitical tension. Going ahead, a decisive close above the previous day's high (22800) remains crucial to signal a pause in the ongoing corrective phase and confirm an improvement in near-term momentum towards 23100 levels. Lack of recovery post gap down opening would result into prolongation of corrective bias
• The 23,100 zone remains the crucial overhead resistance, above which it would improve the prospects of an extended recovery towards 23,500. Failure to close above 23100 level could lead to prolonged consolidation within the broader range 23100-22200
• Nifty continues to hold its ground above the long-term 200-week Exponential Moving Average (EMA) despite global headwinds. Historical data from the past 25 years indicates that, excluding the structural crises of 2001, 2008, and 2020, the median correction following a breach of this key moving average has been limited to 3%. Accumulating equities during such panic periods has historically yielded average returns of 10% over the subsequent 3 to 6 months.
• The current market correction appears to be approaching price-wise maturity, drawing parallels to the eight structural bull market corrections observed over the past 25 years. Those historical instances concluded with an average downside of 17%. Given that the index has already corrected approximately 16% from its January 2026 lifetime high of 26,373, the current downside risks look largely contained.
• Volatility is expected to remain elevated due to escalating geopolitical tensions and rising crude oil prices ahead of the US Midterm elections. Amidst such volatility, strong support is placed at 22,200–21,700, which represents the 61.8% retracement of the October 2023 to September 2024 rally (18,838–26,277) and coincides with the April 2026 low.
Key Monitorables
• US Fed meet
• Crude Oil
• US 10 Year Bond yields
Intraday Rational :
Trend – High wave candle near short term moving average signifies prolonged consolidation
Levels – Sell around Tuesdays close
Nifty Bank : 53974
Technical Outlook
Day that was :
Bank Nifty ended the day on negative note down 0.7% at 53974 on back of mixed global cues. However, the Nifty PSU Bank relatively outperformed for the day gaining 0.4% for the day.
Technical Outlook :
• The index started the day on negative note and remained southward wherein intraday pullbacks were short lived. The daily price action formed is bear candle with higher high higher low indicating breather at higher levels.
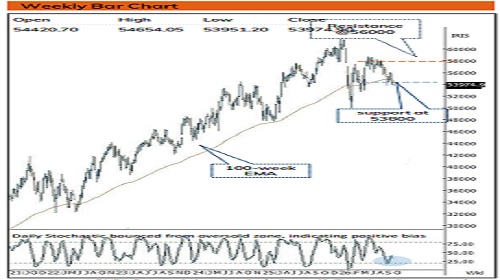
• Going ahead volatility is likely to remain elevated ahead of US Fed meet outcome. Index failed to close above previous session high for seventh consecutive session indicating bias remains corrective as long as it forms lower high lower low formation. A decisive close above previous session high(54654) will be a prerequisite to pause the ongoing corrective phase.
• The breach of immediate support of 53800 would result into extended correction wherein next support is placed at 53000 being 61.8% retracement of Apr-Jun rally (49950- 58700)
• NiftyPSU Bank Index relatively outperformed for the day formed bull candle with higher high higher low indicating positive bias.
Please refer disclaimer at https://secure.icicidirect.com/Content/StaticData/Disclaimer.html
SEBI Registration number INZ000183631