
Nifty Extends Uptrend with Strong Bullish Candle - ICICI Direct

Nifty : 23440
Technical Outlook
Day that was ..
India’s equity benchmark outshone global peers as the week settled on a strong The equity benchmark started the week on a upbeat mode as Nifty gained 23440, up 388 points or 1.7% as cool off in crude oil prices, bond yields and optimism surrounding progression of deescalation boosted the market sentiment. Market breadth remained sturdy with A/D ratio n of 2:1. Sectorally, Oil & Gas and Metals led the relative performance with robust gains. Meanwhile, IT relatively underperformed.
Technical Outlook :
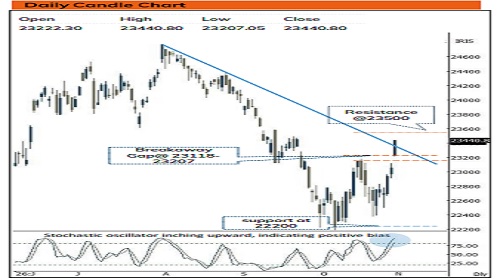
• The index witnessed a gap up opening and held above the gap area throughout the day. Consequently, daily price action resulted in a sizable bull candle, carrying higher high-low, indicating continuation of upward momentum.
• The index witnessed a breakaway gap and logged a breakout from five weeks consolidation range (23200-22200) coincided with three months falling trend line. This price improvement signifies structural revival. However, going ahead, volatility is likely to remain elevated as global focus turns to the US mid-term elections. The outcome is set to shape key macro variables, including crude oil prices and US 10-year bond yields, with meaningful ripple effects on growth-oriented emerging markets like India.
• Amid this volatile backdrop, we expect Nifty to consolidate within the broader 23,500–21,700 range. A decisive close above 23,500 would confirm the conclusion of the corrective bias and open the door for the next leg of the up move. On the downside, strong support remains at 21,700 that has held firm over the past two year.
• Despite persistent global headwinds, Nifty has shown remarkable resilience by holding above its long-term 200-week EMA for the fifth consecutive week. A 25-year historical data reveals that, barring the extreme episodes of 2001, 2008, and 2020, breaches below the 200-week EMA have rarely extended beyond a median decline of ~3%. In current scenario that corroborates with key support level of 21700. More importantly, building medium term portfolio during such episodes has historically garnered 10% returns over the following 3-6 months.
• The Indian market had lagged its global counterparts due to AI-driven momentum. However, the recent global sell-off in AI-driven stocks, driven by concerns about Fed rate hikes and the financing of AI investments, could provide a supportive tailwind for the growth-oriented Indian market, potentially attracting FII’s in the near future.
• Nifty midcap index staged a rebound after defending its key long-term rising trend line that coincides with price parity of 16% correction seen during early part of 2026. Thereby follow-through strength would help to revive the upward momentum in the broader market
Monitorable Key Indicators:
• US Mid-term Election
• Crude Oil & US 10 year Yield
Intraday Rational :
• Trend – Formation of higher high low signifies positive bias
• Levels – Buy around 50% retracement of Mondays range
Nifty Bank : 55002
Technical Outlook
Day that was :
Bank Nifty settled the session on a positive note, up 0.6. At 55002 levels. Meanwhile, the Nifty PSU Bank relatively outperformed by gaining 1.3% for the day.
Technical Outlook :
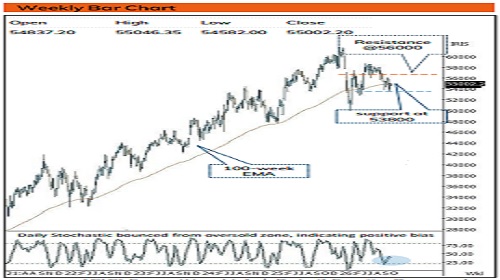
• The index started the week with gap-up opening and thereafter traded within Friday’s high-low range indicating breather at higher levels. Index witnessed buying demand from previous session low around 54600 in second half. The daily price action formed is bull candle inside previous session candle.
• Going ahead volatility is likely to remain elevated ahead of US mid-term election. Going ahead, follow through strength above last week’s high 55070 would help index to extend the pullback towards 56000 mark being 80% retracement of recent decline.
• In the process, 53800 would continue to act as immediate being placement of September low
• Nifty PSU Bank Index formed bull candle with higher high higher low and closed above its 200-day EMA indicating positive bias. The formation of higher high-low on the weekly chart would open the door for meaningful pullback.
Intraday Rational :
• Trend - Robust recovery from key support of 53800 confirms strong support zone
• Levels : Buy around 50% retracement of Mondays range.
Please refer disclaimer at https://secure.icicidirect.com/Content/StaticData/Disclaimer.html
SEBI Registration number INZ000183631