Nifty Defends 24,000 Trendline Support - ICICI Direct Ltd

Nifty : 24232
Technical Outlook
Day that was ..
Equity benchmark snapped seven session losing streak tracking buoyant global cues. Nifty settled Thursday’s session at 24232, up 154 points. Market breadth turned positive with A/D ratio of 1.5:1. Sectorally, financials, IT, realty staged a rebound.
Technical Outlook :
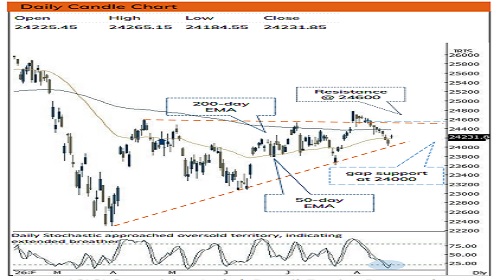
• The index started the session with a positive gap and sustained above the same throughout the day. The daily price action resembles a doji like candle carrying higher high-low, indicating buying demand emerging from rising trendline amid oversold territory.
• The index has once again defended its four months rising trend line placed around psychological mark of 24000. Consequently, after 12 sessions of subdued price action, index has broken its downward spell by forming a higher high-low formation.
• Key point to highlight is that similar pattern was observed during Sept-25 & Jun-26. In both cases, after 8-12 sessions corrective phase, index staged a 5-6% rally after closing above previous session high in subsequent weeks. The current structural shift highlights revival in momentum and restore the positive bias wherein we expect Nifty to gradually resolve higher towards 24600 levels in coming weeks.
• Index has undergone slower pace of retracement as over past 13 sessions, index has retraced 61.8% of preceding 7 sessions 1150 points rally, indicating healthy consolidation (24600- 23600). Hence, any corrective dips should be viewed as an accumulation opportunity in a stock backed by strong earnings wherein strong support is placed at 24000 being rising trend line.
• Mirroring the benchmark move, the Midcap index has been minor correction. Yet sustaining well above its 20 days EMA while trading in the vicinity of All Time High. This outperformance is further validated by strength in the market breadth as currently 56% of stocks of Nifty 500 universe are trading above 200 days SMA compared to three weeks back reading of 48% that bodes well for durability of buoyancy in the broader market.
Intraday Rational :
• Trend – over the past seven sessions, the index has retraced merely 50% retracement level of preceding seven session ~1150-point upmove, indicating slower pace of retracement.
• Levels – Buy around Thursday gap-area.
Nifty Bank : 57496
Technical Outlook
Day that was :
Bank Nifty settled the Sensex weekly expiry session on positive note at 57496 up 0.45%.
Te chnical Outlook :
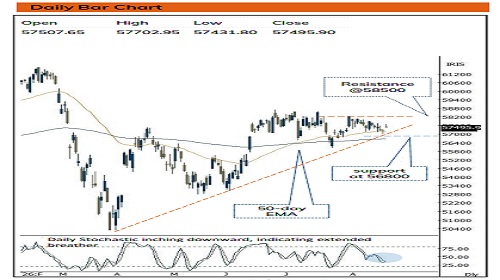
• Index started the day on a positive note but failed to capitalise the initial up move and pared the gains in last hour of trade. As a result, the daily price action formed another high wave like candle, with higher high higher low indicating positive bias.
• Index has snapped its 12 sessions losing streak and formed higher high higher low and gave close above previous sessions high indicating conclusion of corrective phase. The index is undergoing healthy consolidation as over past 12 sessions index has merely retraced 50% of preceding seven session rally (56023-58248) yet managed to sustain above its 50 day, 100 day and 200 days EMA. This healthy consolidation would set the stage to resolve higher and challenge the upper band of consolidation placed at 58500 in the coming week. In the process, strong support is placed around 56800 being the placement of four months rising trendline coincided with 100 days EMA
• Another observation is that over last 7 weeks Index has retraced by 38.2% of earlier 3 weeks rally, indicating slower pace of retracement which would help to set stage for next leg of rally.
• The PSU Bank Index also formed bear candle with higher high higher low, indicating healthy consolidation above 20 days EMA. Going ahead, follow through strength above last week (8857) high would open the door for next leg of up move towards 9100 levels
Intraday Rational :
• Trend - Prolongation of consolidation in vicinity of 57500, indicating positive bias
• Levels : Buy around Thursday gap-area
Please refer disclaimer at https://secure.icicidirect.com/Content/StaticData/Disclaimer.html
SEBI Registration number INZ000183631