Nifty & BankNifty Weekly Outlook 20th March 2026 by Choice Broking Ltd

NIFTY WEEKLY OUTLOOK
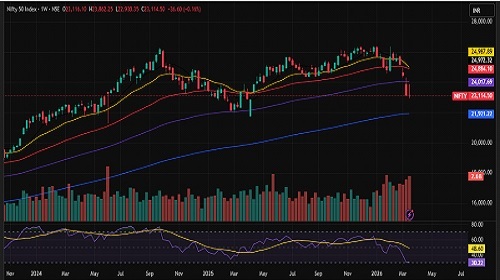
The NIFTY 50 experienced pronounced intraday volatility during the week, ultimately closing in the red for the fourth straight week, signaling sustained market uncertainty and weak sentiment. The index began the week on a flat note but soon gained momentum, extending its buying interest and reaching a high of 23,862.25, which indicated short-term bullish intent. However, this upward move was not sustained, as the index witnessed a correction, declining to a low of 22,930.35. It eventually settled at 23,114.50, posting a marginal loss of 36.60 points (-0.16%), suggesting continued selling pressure at higher levels and a lack of strong follow-through buying.
Overall, the index has declined nearly 13% from its all-time high, underscoring a significant corrective phase in the broader market. From a momentum standpoint, the weekly RSI stands at 30.22, reflecting near-oversold conditions and weak underlying momentum.
From a technical levels perspective, 23,850 remains the immediate resistance, followed by 24,000 and 24,150. On the downside, 22,950 and 22,700 serve as crucial support levels, with a break below 22,700 potentially triggering accelerated downside movement. Traders are advised to stay cautious and adhere to strict risk management practices amid the prevailing volatility.
Support Levels :- 22,950 -22,700
Resistance Levels :- 23,850-24,150
Overall Bias :- Sideways to Bearish
BANKNIFTY WEEKLY OUTLOOK
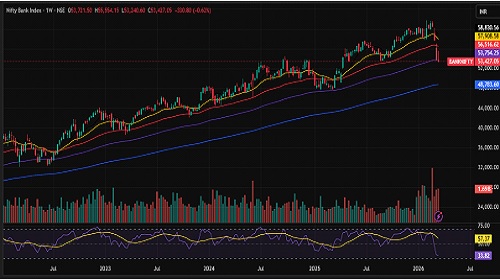
Bank Nifty opened on a flat note and showed strength during the early trading sessions of the week, rallying to a high of 55,554.15, suggesting initial bullish momentum and buying interest. However, the index failed to sustain at higher levels, indicating selling pressure, and underwent a correction, forming a weekly low of 53,240.60. It eventually closed at 53,427.05, ending in the red for the 4th consecutive week, which suggests persistent weakness and continued bearish sentiment in the market. Price action weakened significantly after the index broke below the crucial 54,000 support level and closed beneath the 100-week EMA, which typically signals a bearish trend reversal and deterioration in the long-term structure.
The index has now corrected nearly 13.5% from its all-time high, indicating that the market is undergoing a deeper corrective phase. In the near term, downside targets are seen in the 53,000–52,000 zone, with the possibility of further decline if selling pressure intensifies. On the upside, 54,000 acts as the immediate resistance, while 54,500 and 55,000 represent the next key supply zones.
From a momentum standpoint, the weekly RSI at 33.82 indicates weak momentum and a move toward the oversold region. A sustained close above 54,000 could signal strengthening bullish momentum and potentially trigger a recovery. However, failure to reclaim this level may keep the index under short-term corrective pressure. Traders should remain cautious and disciplined while monitoring key levels for the next directional move.
Support: 53,000-52,000
Resistance: 54,000 -55,000
Overall Bias :- Sideways to Bearish
For Detailed Report With Disclaimer Visit. https://choicebroking.in/disclaimer
SEBI Registration no.: INZ 000160131