Nifty & BankNifty Weekly Outlook 16th March 2026 by Choice Broking Ltd

NIFTY WEEKLY OUTLOOK
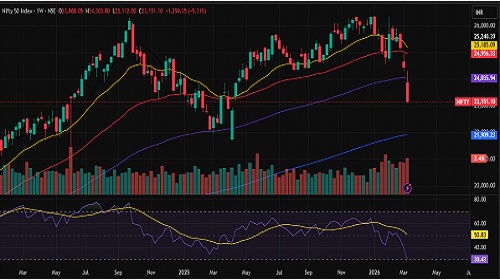
The NIFTY 50 witnessed sharp intraday volatility throughout the week, reflecting heightened uncertainty and persistent selling pressure in the broader market. The index started the week with a steep gap-down of nearly 560 points, indicating strong bearish sentiment and a negative opening reaction from market participants. The decline continued during the week, with the index slipping to a weekly low of 23,112 and finally closing at 23,151.10, registering a loss of 1,299.35 points (-5.31%) for the week. The formation of a strong bearish weekly candle suggests aggressive selling pressure and continued weakness in the near-term trend.
Technically, the index delivered a decisive close below the 0.618 Fibonacci retracement level from last year’s low and also below the 100-week EMA, indicating a breakdown in the medium-term market structure and pointing toward a broader bearish trend. Overall, the index has corrected nearly 12% from its all-time high, highlighting a deep corrective phase in the market. From a momentum perspective, the weekly RSI at 30.43 reflects weak momentum and conditions approaching the oversold zone.
From a levels perspective, 23,500 remains the immediate resistance, followed by 23,700 and 23,850. On the downside, 23,000 and 22,800 act as key support levels, while a break below 22,500 could accelerate further downside pressure. Traders should remain cautious and maintain strict risk management amid ongoing volatility.
Support Levels :- 23000-22500
Resistance Levels :- 23500-23850
Overall Bias :- Sideways to Bearish
BANKNIFTY WEEKLY OUTLOOK
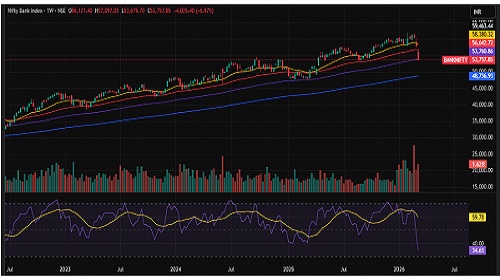
The NIFTY Bank ended the week on a negative note, closing at 53,757.85, registering a weekly decline of 4,025.40 points. The formation of three consecutive red weekly candles reflects sustained bearish pressure and continued selling interest in the index. Price action weakened significantly after the index broke below the crucial 55,000 support level and closed beneath the 100-week EMA, which typically signals deterioration in the broader trend and indicates that sellers currently have control of the market.
The index has now corrected nearly 13% from its all-time high, suggesting that the market is undergoing a deeper corrective phase. In the near term, downside targets are seen in the 53,000–52,000 zone, with the possibility of further decline if selling pressure intensifies. On the upside, 54,500 acts as the immediate resistance, while 55,000 and 55,500 represent the next important supply zones.
From a momentum standpoint, the weekly RSI at 34.63 indicates weak momentum and proximity to the oversold zone. A sustained close above 54,500 could signal strengthening bullish momentum and potentially trigger a recovery. However, failure to reclaim this level may keep the index under short-term corrective pressure. Traders should remain cautious and disciplined while monitoring key levels for the next directional move.
Support: 53000-52000
Resistance: 54500 -55500
Overall Bias :- Sideways to bearish
For Detailed Report With Disclaimer Visit. https://choicebroking.in/disclaimer
SEBI Registration no.: INZ 000160131