Nifty & Bank Nifty Weekly Outlook 22-08-2026 by Choice Broking Ltd

NIFTY WEEKLY OUTLOOK 22-08-2026
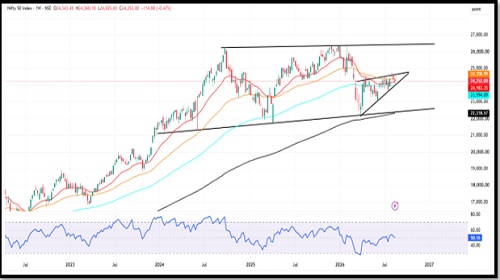
The Nifty 50 witnessed a volatile week, with selling pressure dominating the initial part before a recovery emerged from lower levels. The index opened at 24,343.45, touched a high of 24,360.10, slipped to a low of 24,025.65, and finally settled at 24,252.00, registering a weekly loss of 114 points (-0.47%). The index remained under pressure through the first half of the week, with consecutive declines, but strong buying interest near the crucial 24,000–24,050 zone helped limit the downside. The recovery from lower levels and the subsequent range-bound movement reflected continued caution and indecision among market participants.
Technically, the weekly candle formed a bearish red candle with a long lower shadow, indicating strong buying interest at lower levels and suggesting that sellers were unable to sustain downside below the 24,000 mark. Nifty has also taken support near the lower trendline of the broader Triangle pattern, which continues to provide an important technical base. The index is trading above the 20-week, 100-week and 200-week EMAs, keeping the broader trend supportive, although it remains below the 50-week EMA, indicating that medium-term momentum is yet to strengthen decisively. The Weekly RSI at 50.16 remains marginally above the neutral 50 level, pointing toward balanced momentum with scope for improvement.
For the coming week, 24,000–23,900 will remain the crucial support zone, while 24,500–24,600 is the immediate resistance area. Sustaining above 24,000 and the lower triangle trendline would indicate continued buying interest on declines and help preserve the current technical structure. On the upside, a decisive move above 24,600 could strengthen recovery momentum and attract fresh buying, while a break below 23,900 may increase selling pressure and weaken the near-term setup. The price action around these levels will therefore remain important for determining the next directional move.
Overall, the technical structure supports a sideways-to-bullish view. The long lower shadow, strong response from the 24,000 zone, support from the triangle trendline, and the index's position above key long-term EMAs provide a constructive underlying setup. A sustained breakout above 24,600 could trigger fresh upward momentum and open the door for further gains, while holding above 24,000 would keep the broader structure intact. Traders should continue to focus on buying opportunities on dips, remain stock-specific, and follow disciplined risk management while closely monitoring these key technical levels.
Support Levels: - 24,000 – 23,900
Resistance Levels: - 24,500 – 24,600
Overall Bias: - Sideways to Bullish
BANKNIFTY WEEKLY OUTLOOK 22-08-2026
Bank Nifty witnessed a positive but volatile week. The index opened at 57,418.30, touched a high of 57,772.45 and a low of 57,001.75, before settling at 57,761.95, gaining 270.85 points (+0.47%) on a weekly basis. During the week, the index remained volatile around key levels, but buying interest emerged at lower levels and supported the recovery. Towards the end of the week, Bank Nifty witnessed a strong upmove and formed a strong bullish weekly candle, resulting in a firm close near the higher end of the weekly range.
The weekly price action indicates improving buying momentum, with the index closing close to its weekly high after holding above the 57,450–57,000 support zone. The strong green candle reflects renewed strength and suggests that buyers remained in control toward the end of the week. The index has also moved back above the short-term moving-average cluster, indicating an improvement in near-term price structure and providing support for further recovery.
From a technical perspective, Bank Nifty continues to trade above the 20-week, 50-week, 100-week and 200-week EMAs, keeping the broader trend constructive. The weekly chart also shows the index approaching a short-term descending trendline resistance near the 58,200–58,500 resistance zone, making the upcoming sessions important for a potential breakout. The Weekly RSI stands at 54.27, remaining above the neutral 50 level and indicating moderate positive momentum. A sustained move above the 58,200–58,500 resistance zone could further strengthen the bullish setup.
For the coming week, the 57,450–57,000 zone will act as an important support area, while 58,200–58,500 remains the key resistance zone. As long as Bank Nifty sustains above the 57,000 support region and the key weekly moving averages, the broader structure is likely to retain a sideways to positive bias. A decisive breakout above 58,500 could strengthen bullish momentum and open the door for further upside, whereas a failure to hold the 57,000 support level may invite renewed selling pressure. Traders are advised to closely monitor price action around these important technical levels.
Support: 57,450–57,000
Resistance: 58,200–58,500
Overall Bias: Sideways to Bullish
For Detailed Report With Disclaimer Visit. https://choicebroking.in/disclaimer
SEBI Registration no.: INZ 000160131