Nifty-Bank Nifty SPOT Weekly Outlook from Bharat K Gala, Technical Head, Ventura

Nifty Spot – Pivot Levels
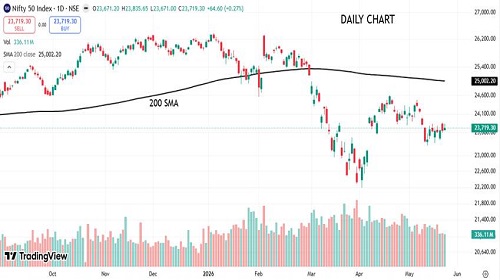
Previous week it was mentioned that, Our view is Sell on rise & below 23262 traders should use (22600- 21715) levels as an opportunity to buy. If the trend is strong Nifty will bounce back from 22600 levels, any close below should be treated as negative for the current uptrend. Currently, (23990-24440)-24810-(25170-25690) as sell areas. If sustain above 25690 we open for 26347 and later further to 26500-26700 area.
Nifty marked a low of 23317.10 but did not breach the previous week’s low of 23262 & later bounce back. Subsequently, the index witnessed a recovery and rallied to mark a high of 23859.90, but faced resistance at higher levels & gave a valid correction. Despite the bounce, the index failed to show strong follow-through buying above higher levels & thereafter, traded flat within a consolidation zone, indicating market indecision. Now, Nifty closed at 23719.30.
Below 23317 (current week low), we have support levels at (22600- 21715) as bounce back levels.
If the trend is strong Nifty will bounce back from 22600 levels, any close below should be treated as negative for the current uptrend. As of now, (24030-24480)-24830-(25190-25700) as sell level areas.
If sustain above 25700 we open for 26347 and later further to 26500-26700 area.
Our view is Negative & below 23317 traders should use (22600- 21715) levels as an opportunity to buy. If the trend is strong Nifty will bounce back from 22600 levels, any close below should be treated as negative for the current uptrend. Currently, (24030-24480)-24830-(25190-25700) as sell areas. If sustain above 25700 we open for 26347 and later further to 26500-26700 area.
Bank Nifty Spot – Pivot Level
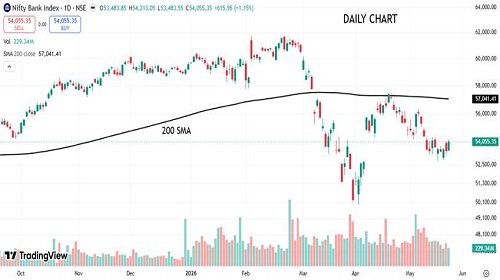
Previous week it was mentioned, Our view is Sell on rise & below 53191 traders should use (52072-49430) levels as an opportunity to buy. If the trend is strong Bank Nifty will bounce back from 52072 levels, any close below should be treated as negative for the current uptrend. Currently, (55215-56470)-57480-(58490-59930) as sell level areas. If sustain above 59930 we open for 61765 and later further to (62540-63470) area.
Bank Nifty breached the previous week’s low of 53191 and extended its decline to mark a low of 52783.45, indicating initial weakness. Thereafter, the index witnessed a recovery & forming higher bottoms rallied to a high of 54213.05. However, the index failed to sustain at higher levels and traded flat, reflecting lack of follow-through buying. This was followed by a corrective move from higher levels, indicating selling pressure near resistance zones. Now, Bank Nifty closed at 54055.35.
Below 52783 (current week low), we have support levels at (52072-49430) as bounce back levels.
If the trend is strong Bank Nifty will bounce back from 52072 levels, any close below should be treated as negative for the current uptrend. As of now, (54910-56220)-57280-(58340-59850) as sell level areas.
If sustain above 59850 we open for 61765 and later further to (62540-63470) area.
Our view is Negative & below 52783 traders should use (52072-49430) levels as an opportunity to buy. If the trend is strong Bank Nifty will bounce back from 52072 levels, any close below should be treated as negative for the current uptrend. Currently, (54910-56220)-57280-(58340-59850) as sell level areas. If sustain above 59850 we open for 61765 and later further to (62540-63470) area.
SMS subject to Disclosures and Disclaimer goo.gl/8bCMyQ
SEBI Registration No.: INH000001634