

Nifty and Bank Nifty Weekly Outlook 08th June 2026 by Hitesh Tailor, Research Analyst, Choice Broking Ltd

NIFTY WEEKLY OUTLOOK
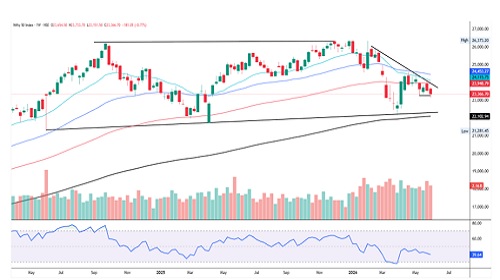
The Nifty index began the week on a positive note, opening with a gap-up of nearly 107 points at 23,654.50. Buying momentum persisted during the early part of the week, pushing the index to its weekly high of 23,733.70 on Monday. However, the benchmark failed to sustain at higher levels as selling pressure emerged near key resistance zones. The corrective move intensified during the mid-week session, dragging the index to a weekly low of 23,151.50 on Wednesday. Nevertheless, strong buying interest from lower levels helped the index recover a portion of its losses. Despite the rebound, Nifty remained under pressure and eventually settled at 23,366.70, down 181.05 points or 0.77% for the week.
From a technical perspective, the RSI on the weekly timeframe is placed near 39.64, indicating weakening momentum and suggesting that the index remains in a neutral-to-bearish zone. Nifty continues to trade below its 20-week, 50-week, and 100-week EMAs, reflecting a cautious undertone in the broader trend. Additionally, the index has witnessed a breakdown from a falling trendline structure, highlighting persistent selling pressure at higher levels. Although buying interest has emerged around the 23,150–23,200 zone, the broader structure suggests that market participants remain cautious amid the absence of strong bullish triggers.
On the upside, immediate resistance levels are placed at 23,900 and 24,100. On the downside, support is seen at 23,200 and 23,000. A decisive breakdown below the 23,000 mark could accelerate selling pressure and open the door for further weakness. Conversely, a sustained move above 24,100 may negate the prevailing bearish structure and support a stronger recovery. Considering the current technical setup, traders are advised to adopt a stock-specific approach while maintaining strict risk management amid elevated volatility.
Support Levels :- 23,200 - 23,000
Resistance Levels :- 23,900 - 24,100
Overall Bias :- Sideways
BANKNIFTY WEEKLY OUTLOOK
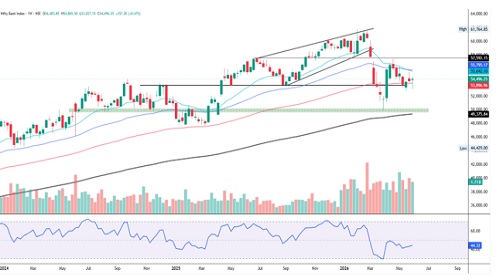
The Bank Nifty index began the week on a subdued note, opening at 54,403.85 and witnessing selling pressure during the initial trading sessions amid cautious market sentiment. Weakness persisted early in the week, and the index slipped to its weekly low of 53,027.15 on Wednesday following a gap-down opening and continued profit booking across major banking counters.
However, the index attracted strong buying interest from lower levels, triggering a sharp recovery during the second half of the week. The rebound gained momentum as Bank Nifty posted consecutive gains and erased a significant portion of its earlier losses. Supported by renewed buying across private and PSU banking stocks, the index climbed to a weekly high of 54,865.50 before witnessing some profit booking near higher levels. Bank Nifty eventually settled at 54,496.25, ending the week with a gain of 257.05 points or 0.47%.
Technically, Bank Nifty continues to trade below its 20-week and 50-week EMA levels, indicating that the medium-term trend remains cautious despite the recent recovery. The index has managed to defend the crucial support zone near 53,000 and formed a strong bullish rebound from lower levels, reflecting improving market sentiment. Weekly RSI stands at 44.32 and has started to edge higher, suggesting a gradual improvement in momentum, although it remains below the neutral 50 mark. Immediate support is placed in the 53,900–53,000 zone, while resistance is seen at 55,000 and 55,800. A decisive breakout above resistance levels could strengthen the recovery momentum in the coming weeks.
Support: 53,900–53,000
Resistance: 55,000–55,800
Overall Bias: Sideways
For Detailed Report With Disclaimer Visit. https://choicebroking.in/disclaimer
SEBI Registration no.: INZ 000160131


Tag News
Resistance: 24300 (Pivot Level) and 24400 (Key Resistance) - GEPL Capital Ltd


More News
_Securities_(600x400).jpg)
"A bullish marubozu signals strong momentum and full bull control." - Tradebulls Securities ...


