Neutral Nestlé India Ltd for the Target Rs.1,400 by Motilal Oswal Financial Services Ltd
Strong quarter; positive comments on demand recovery
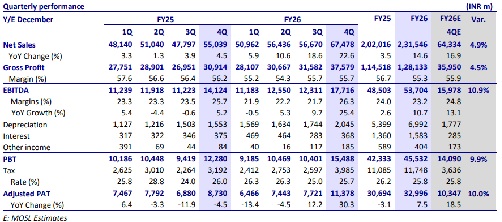
* Nestlé India (Nestle) reported strong performance in 4QFY26, with revenue growing 23% YoY (beat; 13% two-year CAGR). Domestic revenue grew 23% YoY (vs. our est. of 17%), driven by double-digit volume growth. Most categories delivered double-digit growth, with steady growth in milk products and nutrition. Nestle experienced market share gains for most of its key segments, reflecting better execution efforts. Export revenue rose 31% YoY.
* We had highlighted in our 4QFY26 preview note (link) that packaged food companies would continue to outperform as key beneficiaries of GST 2.0. Nestle has delivered strong performance since 2QFY26, backed by its investments in brands, strengthening distribution, and expanding capacity. These initiatives have been supported by a broader market recovery following GST 2.0, as ~85% of Nestle’s portfolio has benefited from it.
* Gross margin dipped 50bp YoY to 55.7% (vs. our est. of 55.9%), which was hit by inflation in key commodities such as milk and edible oils. Wheat availability was also affected by unseasonal rains, which led to delayed harvests and lower quality output. Coffee prices continued to soften. Despite these factors, EBITDA margin expanded 60bp YoY to 26.3% (at an all-time high), led by cost efficiencies. EBITDA grew 25% YoY (vs. our est. of 13%). We model an EBITDA margin of 23.9% for FY27E and 24.3% for FY28E.
* The company had faced gross margin pressures over the past four quarters due to raw material inflation. Rising crude prices amid ongoing geopolitical tensions remain a key concern; however, packaged food companies (15– 20% crude linkage) are relatively less exposed compared to HPC players (25– 30%). That said, persistent geopolitical risks could keep inflation elevated and may weigh on broader demand recovery in 2026.
* We model a revenue/EBITDA/APAT CAGR of 12%/15%/17% over FY26-28E. The stock is trading at 68x/60x FY27/FY28 EPS. Given its expensive valuation, we reiterate our Neutral rating with a revised TP of INR1,400 (based on 60x P/E Mar'28E).
All-round beat; raise expectations for food peers
* Third consecutive quarter of revenue beat: Nestle’s net sales jumped 23% YoY to INR67.5b (est. INR64.3b) in 4QFY26. It is the third consecutive quarter of revenue outperformance. Domestic sales grew 23% YoY to INR64b, while exports jumped 31% YoY to INR2.8b. This growth was fueled by double-digit volume growth. The company has achieved its strongest volume growth in the last five years.
* Volume-led growth across most segments: The confectionery segment grew at a high double-digit pace in both value and volume, led by transaction growth in brands. The prepared dishes and cooking aids product group registered strong value growth, fueled by volume. The powdered and liquid beverages category recorded high double-digit growth (19 quarters in a row). The Milk Products and Nutrition product group showed steady growth. The pet food business delivered strong double-digit growth, propelled by innovation and distribution.
* Commodity prices remained elevated: The company’s gross margin contracted 50bp YoY to 55.7% (est. 55.9%), given elevated RM prices. Management indicated that milk prices have not softened and are expected to remain elevated through the summer lean season. Edible oil prices remain elevated and have moved higher along with crude prices. Coffee prices continue to decline due to favorable crop yields in Vietnam and forthcoming crops in Brazil. Wheat has been affected by unseasonal rains in Apr’26, resulting in a delayed harvest and lower quantity and quality.
* All-time high operating margin: Other expenses grew 26% YoY while employee expenses were flat YoY. EBITDA margin expanded 60bp YoY to 26.3% (est. 24.8%, 21.7% in 3QFY25), at an all-time high. EBITDA grew 25% YoY to INR17.7b (est. INR16b). PBT grew 26% YoY to INR15.5b (est. INR14.1b), while Adj. PAT grew by 30% YoY to INR11.4b (est. INR10.3b).
* In FY26, the revenue, EBITDA, and APAT grew 15%, 11%, and 8%, respectively.
Valuation and view
* We raise our EPS estimates by 4-5% for FY27 and FY28. ? GST 2.0 stimulates consumption, drives affordability, and contributes to the overall growth of the FMCG sector. About 85% of the company’s portfolio has benefited from the GST 2.0, leading to strong volumes across LUPs and larger packs. Apart from macro tailwinds, Nestle’s own initiatives, such as its investments behind brands, strengthening distribution, and increasing capacity, are cumulatively boosting strong performance delivery.
* Rising crude prices amid ongoing geopolitical tensions remain a key concern; however, packaged food companies (15–20% crude linkage) are relatively less exposed compared to HPC players (25–30%). That said, persistent geopolitical risks could keep inflation elevated and may weigh on broader demand recovery in 2026.
* We model a revenue/EBITDA/APAT CAGR of 12%/15%/17% over FY26-28E. The stock is trading at 68x/60x FY27/FY28 EPS. Given its expensive valuation, we reiterate our Neutral rating on the stock with a revised TP of INR1,400 (based on 60x P/E Mar'28E).
For More Motilal Oswal Securities Ltd Disclaimer
http://www.motilaloswal.com/MOSLdisclaimer/disclaimer.html
SEBI Registration number is INH000000412