Neutral JSW Cement Ltd for the Target Rs 135 by Motilal Oswal Financial Services Ltd
Performance above estimates; expansion on track Expects demand to improve; cost-saving initiatives on track
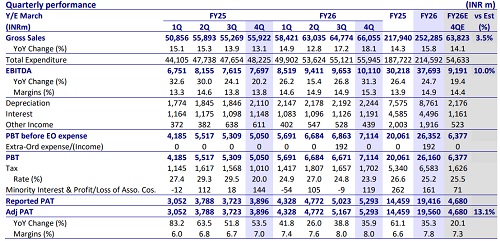
* JSW Cement’s (JSWC) 4QFY26 performance was above our estimates, led by higher-than-estimated realization and lower opex/t. EBITDA increased ~46% YoY to INR3.7b (~18% beat). OPM rose 4.6pp YoY to ~19% (est. ~17%). EBITDA/t grew ~36% YoY to INR915 (est. INR777). Adj. PAT jumped 4x YoY to INR1.6b in 4QFY26 (vs. est. of INR467m).
* Management noted that demand was soft in Apr’26 due to external factors. However, it is normalizing gradually in May’26 and could become stable going forward. JSWC has achieved over 50% of its targeted cost savings so far, and expects to reach ~75% by FY27 and fully materialize by FY28, led by an increase in green power share, logistics efficiencies, and premiumization. It has approved a 2.5mtpa additional grinding capacity at Nagaur (INR4.3b capex, targeted by Jan’28), taking total capacity to 6.0mtpa, due to delays in Punjab clearances and the need to optimize clinker utilization.
* We raise our EBITDA estimates by ~3-4% for FY27/FY28. However, we raise our PAT estimates by ~32%/~27% for FY27/FY28, primarily due to lower tax rate following the company’s shift to the new tax regime. At CMP, the stock is trading fairly at 15x/13x FY27E/FY28E EV/EBITDA. We value JSWC at 13x FY28E EV/EBITDA to arrive at our TP of INR135. Maintain Neutral.
Sales volume up 7% YoY; EBITDA/t increases 36% YoY to INR915
* Consolidated revenue/EBITDA stood at INR18.9b/INR3.7b (up 11%/46% YoY and up ~3%/18% vs. our estimate). Adj. PAT rose 3.0x YoY to INR1.6b. Overall volume grew ~7% YoY to 4.0mt. Cement volume stood at 2.4mt (up 12% YoY) and GGBS was 1.6mt (up 5% YoY). Blended realization/t increased 4% YoY/QoQ to INR4,749/t (+2 vs. estimate). Cement realization grew ~1% YoY/5% QoQ, while GGBS realization declined ~1% YoY (+1% QoQ).
* Opex/t declined ~2% YoY (~2% below our estimate), led by ~16%/9% decline in employee cost/other cost per ton, while freight cost/t increased ~3% YoY. Variable cost/t was flat YoY. EBITDA/t grew 36% YoY to INR915. Depreciation increased ~6% YoY, while interest cost declined ~22% YoY.
* In FY26, revenue/EBITDA stood at INR65.1b/INR12.4b (up ~12%/45% YoY). Adj. PAT was INR4.9b vs. net loss of INR58m in FY25. Sales volume rose 11% YoY. Realization/t grew ~1% YoY to INR4,662. EBITDA/t grew ~31% YoY to INR888. OCF stood at INR11.7b vs. INR7.4b in FY25. Capex was INR19.6b vs. INR11.5b in FY25. Net cash outflow was at INR7.9b vs. INR4.2b in FY25
Valuation and view
* JSWC reported strong earnings in 4QFY26, led by strong volume-led growth and better operating performance. However, the near-term outlook remains measured, as soft demand in April and high costs may weigh on margins. JSWC’s strategy remains structurally compelling, with a differentiated low clinker ratio, higher GGBS mix, and sharp cost-saving measures (INR100/t, annual cost savings over FY27-28). Entry in the north opens a long-term growth runway; however, execution and pricing traction remain key monitorables.
* We estimate a CAGR of ~20%/21%/8% in revenue/EBITDA/adj. PAT over FY26-28, driven by higher sales volume. EBITDA/t is estimated to be INR851/INR930 in FY27/FY28 vs. INR888 in FY26. Net debt is estimated to be INR64.3b in FY28 vs. INR35.9b as of FY26 due to aggressive capex. The net debt-to-EBITDA ratio is estimated to increase to 3.5x by FY28E vs. 2.9x in FY26. At CMP, the stock is trading fairly at 15x/13x FY27E/FY28E EV/EBITDA. We value JSWC at 13x FY28E EV/EBITDA to arrive at a TP of INR135. Maintain Neutral.
For More Research Reports : Click Here
For More Motilal Oswal Securities Ltd Disclaimer
http://www.motilaloswal.com/MOSLdisclaimer/disclaimer.html
SEBI Registration number is INH000000412






Tag News
Cement Sector Update : Muted Pricing and Higher Cost to Cap Profitability by Choice Institut...