Motilal Oswal Financial Services Ltd. Silver Enters a New Era of Structural Revaluation — Prices Set to Touch $77/oz by 2027
Silver and its Story of Unprecedented Rise – Why it seems different this time?
“There are decades where nothing happens; and there are weeks where decades happen“ -Vladimir Ilyich Lenin
Strategic Outlook: The Dual Identity Bull Thesis and Price Vectors
Executive Summary:
The Confluence of Industrial Acceleration and Investment Momentum
Silver market is currently exhibiting dynamics consistent with a major structural revaluation, distinguishing current rally from previous speculative cycles. The primary driver is silver's dual identity as both a critical industrial commodity, accounting for 59% of total usage, and a safe-haven asset sought during geopolitical instability. This convergence has fuelled an unprecedented surge in 2025, with prices exceeding $51.30 per ounce by October, representing gains upwards of 70% year-to-date.
This appreciation is fundamentally supported by persistent market dynamics. Global silver supply has failed to keep pace with demand for seven consecutive years, leading to a structural market deficit, which is forecast to continue for a fifth consecutive year in 2025. This structural shortfall creates a unique floor for prices. Simultaneously, geopolitical risk, persistent inflationary concerns, and renewed investor interest, evidenced by significant inflows into exchange-traded products (ETFs)—reaching 95 million ounces in the first half of 2025 — provide the speculative leverage required for sharp price increases.
The metal's volatility, which sees silver move approximately 1.7 times faster than gold in either direction, confirms that the current rally is fundamentally stronger than speculative bursts seen in 1980 or 2011. The underlying industrial demand foundation (driven by green economy technologies like solar and electric vehicles) is irreplaceable, suggesting that the established supply constraints will necessitate sustained price elevation to ration industrial consumption and incentivize marginal supply increases.
The silver market in 2025 has captured renewed investor attention as prices surged to multi-year highs. However, unlike the historic rallies of 1980 (hunt brothers) and 2011(QE + hyperinflation)—both of which ended in sharp reversals of more than 50%, after touching near $50 mark—current uptrend appears more stable, grounded in fundamentals rather than speculative excess. A closer look at the drivers of this year’s rally reveals a very different macro and structural setup, suggesting that silver’s ascent this time may be part of a longer-term revaluation rather than a fleeting bubble.
This year’s rally is driven by strong industrial demand from sectors like solar energy, electric vehicles, 5G, and AI, making silver critical to the global green transition. Meanwhile, supply constraints such as stagnant mining and limited recycling have tightened the market. Unlike past speculative surges, this rally features balanced participation from institutional investors and central banks, supported by a disinflationary macro environment with gradual monetary easing. Enhanced market regulations and a steady gold-silver ratio decline signal a more sustainable and structural repricing, marking silver as a strategic metal rather than a speculative asset.
Global Price Projections (USD): Breaking the $50+ Threshold
Following the sharp rally in 2025, which saw silver breach $35 per ounce in the first half and achieve a 14-year high of $44.11 in September before surging past $51.30 in October, consensus among bullish analysts suggests continued momentum. Our initial forecasts for 2025 were aggressive, expecting the price to test all-time highs and reach $50. The market performance has validated the higher end of these projections and now the question of how long and how high it can go? Is at its loudest.
For the medium term (2026–2027), the tightening market structure is expected to push prices significantly higher. We believe a consolidation around the $50 -55 mark over the next few months could be possible, with potential peaks reaching $75.00 per ounce by the year of 2026, and a sustained movement toward $77.00 per ounce in 2027 on COMEX; assuming average USDINR stays around 90; Rs.2,40,000 by 2026 year end and Rs. 2, 46,000 on domestic front.
The significance of the $50 psychological breakout cannot be overstated. Silver has historically failed to sustain prices above this level, with past attempts resulting in deep corrections as profit-takers exited the market. However, the current rally is distinct. Unlike previous speculative spikes (1980, 2011), the 2025 surge is fundamentally underpinned by irreversible, material demand from the green energy transition and expanding technology sectors (EVs, Solar, 5G). This fundamental support suggests that breaking $50 is not merely a technical event but a necessary repricing mechanism to balance global demand with constrained supply, thereby establishing a new, higher baseline for the metal going forward.
INR Valuation Uplift: The Role of USD/INR in Indian Silver Price
For investors based in India, the investment case for silver is substantially amplified by foreign exchange dynamics. Precious metals denominated in USD often yield magnified returns in local currency terms when the domestic currency depreciates against the dollar. The Indian Rupee (INR) has faced significant downward pressure, particularly due to macroeconomic factors including tariffs announced by the US President on Indian imports (effective August 2025) and consistent sell-offs by Foreign Institutional Investors (FIIs) beginning in July 2025.
Forecasts for the USD/INR exchange rate project a gradual depreciation of the Rupee. Consensus estimates suggests the USD/INR pair moving between 88.00 and 90.00 before the end of Q4 2025, following a peak of 88.45 earlier in the year. Looking ahead to the 2026–2030 period, experts broadly agree that the INR will continue its gradual decline against the USD, clustering between 90.00 and 102.00 INR per USD, driven by global monetary policy and underlying economic fundamentals.
The implication for INR-denominated assets is clear: a rising USD silver price combined with simultaneous INR depreciation creates powerful leverage. If the dollar price of silver reaches the bullish targets of $70 per ounce by 2027 and the INR depreciates to the upper end of the projected 92.00–95.00 range, the percentage returns for Indian investors are significantly enhanced. This compounding effect mitigates the impact of potential local price corrections and enhances silver's role as a portfolio stabilizer in an environment of currency weakness.
The Structural Bull Case: Industrial Demand Analysis and Projections
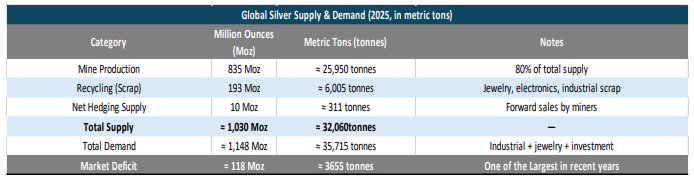
Global Silver Supply and Demand Snapshot
Global mine production in 2024 was around 26,000 tonnes (~840 million ounces). Recycling added ~5,000 tonnes (~160 million oz), bringing total supply to ~31,000 tonnes. Total demand was roughly equivalent, leaving little surplus. Key demand segments include industrial use (solar, EVs, electronics), jewellery, silverware, and investments (bars, coins, ETFs).
Industrial Demand Metrics and Deficit Persistence
Industrial demand is the bedrock of the current silver bull market, representing the largest single component of usage. It is the largest and fastest-growing segment, expected to rise by 5–6% annually through 2027, primarily due to clean energy applications. In 2024, industrial silver use reached a record high of 680.5 million ounces (Moz), an 11% increase from the previous year. This upward trajectory is expected to continue, with projections indicating that industrial fabrication will surpass 700 Moz for the first time in 2025. This robust industrial consumption is the principal factor driving the market into a persistent supply deficit.
The silver market is forecasted to remain in a deficit for the fifth consecutive year in 2025, with a projected shortfall of ~118 Moz. This structural imbalance underscores the metal's critical role in the green economy.
The responsiveness of silver supply to increased prices is significantly limited, a fundamental factor exacerbating the deficit. Approximately 75% of global silver production is derived as a by-product from the mining of base metals, primarily copper, lead, and zinc. This by-product dynamic means that silver supply cannot respond directly or quickly to sharp increases in the silver price, as production decisions are tied to the economics and multi-year capital investment cycles of the primary base metals. Analysis by Wood Mackenzie indicates that the price elasticity of supply has diminished: while historically a 10% price increase might generate a 5–7% supply response, it now generates only a muted 2–3% response. This inelasticity ensures that as highly elastic, technology-driven industrial demand continues to grow, it will continuously outrun marginal supply increases, forcing the market to rely on depleting above-ground inventories and driving prices sharply higher for rationing purposes.
Photovoltaics (PV): The Consumption King and The Thrifting Paradox
The solar sector is the primary driver of this demand acceleration. In 2025, the solar photovoltaic (PV) segment is projected to account for 14% to 20% of global silver demand, consuming over 200 million ounces annually. Global solar installations are expected to maintain double-digit growth through 2030. By 2027, projections suggest that solar manufacturers may require more than 20% of the current annual silver supply to meet installation targets.
The industry faces a structural challenge known as the Thrifting Paradox. Due to the rapid rise in the price of silver (gaining over 68% in nine months to reach $49 per ounce by October 2025), PV module makers have aggressively implemented "thrifting" measures to reduce the amount of silver paste needed per panel. Despite these technological efforts, which slowed PV-specific demand growth in 2024, the sheer volume growth of global solar capacity is overwhelming the thrifting gains. Furthermore, the shift toward more efficient cell technologies, which improve energy output (like N-type cells), often requires more initial silver input. Therefore, while thrifting attempts to mitigate consumption, the technological requirements for higher efficiency and the colossal scale of global solar deployment collectively ensure sustained, high-volume demand pressure. Projections indicate the PV industry may require up to 14,000 tonnes (approximately 450 Moz) of silver per year by 2030, a monumental figure when set against the global mine supply base of approximately 34,000 tonnes.
Above views are of the author and not of the website kindly read disclaimer