Weekly Technical Outlook and Picks : Vedanta Ltd, ICICI Prudential Life Insurance Company Ltd, Ashok Leyland Ltd - Axis Securities Ltd

Vedanta Ltd
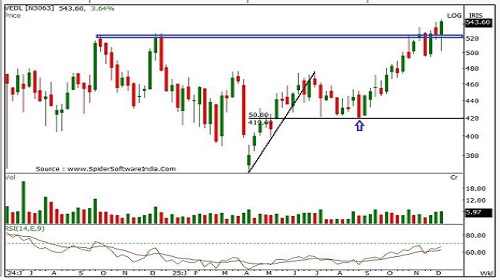
Buy Vedanta Ltd CMP 544 @ 539-529 Stop loss: 513 Upside: 8% –13%
* On the weekly chart, VEDL delivered a decisive breakout above the strong multi-resistance zone near 527. The breakout was accompanied by a bullish candle, signalling a positive bias and the continuation of the medium-term uptrend.
* It continues to trade above key moving averages (20-, 50-, 100-, and 200-day SMAs), reflecting strong momentum and a positive bias across both short- and medium-term timeframes.
* The stock maintains a higher high–low structure and trades well above its rising trendline, highlighting a strong bullish setup.
* Momentum indicators also align with this view, as the weekly RSI is also holding above its upward-sloping trendline and its reference line, validating the strength in price action.
* The above analysis indicates an upside toward 576-603 levels. * The holding period is 3 to 4 weeks
ICICI Prudential Life Insurance Company Ltd
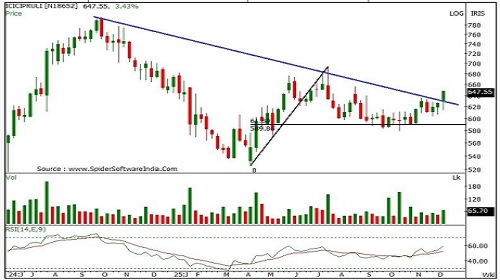
Buy ICICI Prudential Life Insurance Company Ltd CMP 648 @ 640-628 Stop loss: 613 Upside: 7%–10%
* ICICIPRULI has delivered a decisive breakout above its medium-term downward sloping trendline at 645, in place since the Sep’24 all-time high — signalling the end of its corrective phase and the start of a medium-term uptrend.
* The stock has rebounded sharply from the 61.8% Fibonacci retracement of the 526–694 rally, reaffirming the 590 zone as a strong support base.
* Weekly RSI has broken above its downward sloping trendline, reinforcing persistent strength and a firming bullish outlook.
* Additionally, RSI continues to hold above its reference line, signalling a persistent positive bias.
* The above analysis indicates an upside toward 676-700 levels. * The holding period is 3 to 4 weeks
Ashok Leyland Ltd
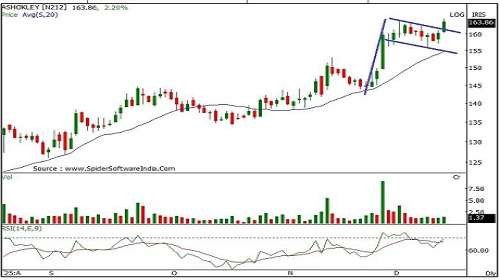
Buy Ashok Leyland Ltd CMP 164 @ 163-160 Stop loss: 155 Upside: 8%–11%
* On the daily chart, ASHOKLEY has posted a decisive breakout above the Bullish Flag pattern at 160, supported by a strong bullish candle — signalling continuation of the medium-term uptrend.
* The stock maintains a higher high–low structure, highlighting a strong bullish setup.
* The daily RSI is trending higher and holding firmly above its reference line, reinforcing positive momentum and a constructive outlook.
* RSI consistently respects its upwardsloping trendline, validating the constructive bias in price action. • The above analysis indicates an upside toward 175-180 levels. * The holding period is 3 to 4 weeks.
For More Axis Securities Disclaimer https://simplehai.axisdirect.in/disclaimer-home
SEBI Registration number is INZ000161633