MOSt Quantitative Outlook Monthly by Motilal Oswal Wealth Mangement

Bank Nifty
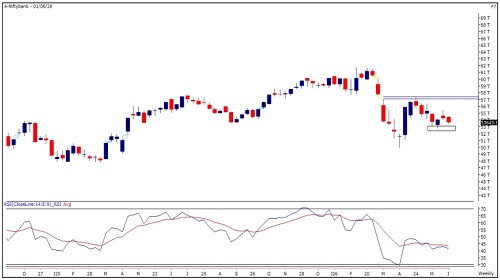
Bank Nifty started on an optimistic note but failed to hold above 56330 levels and witnessed some profit booking thereafter. It showed some excitement towards the end and approached 55550 levels. On the monthly scale it formed a small bodied bearish candle and an Inside bar and continued making lower highs from the last three months. Price action suggests that a hold above 54000 zones could see momentum driving towards 55550 then 56000 zones while on the downside support is placed at 53000 and then 52250 zones.
Nifty IT Index
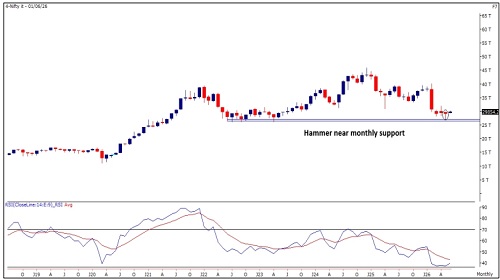
The Nifty IT Index has formed a Hammer candlestick pattern on the monthly timeframe, signaling a potential exhaustion of the recent corrective phase and indicating the possibility of a trend reversal. The index is currently trading near 30000 mark and needs to sustain above 30500 to confirm renewed bullish momentum. The formation of the Hammer pattern, coupled with a mean reversion setup, suggests that downside pressure may be easing and a recovery phase could unfold if key resistance levels are surpassed. Based on the current technical structure, the index has the potential to move towards 33500 and 34020 levels. On the downside, immediate support is placed at 28000 then 26100 zones
Investment in securities market are subject to market risks, read all the related documents carefully before investing
Relative Rotation Graphs (RRG):
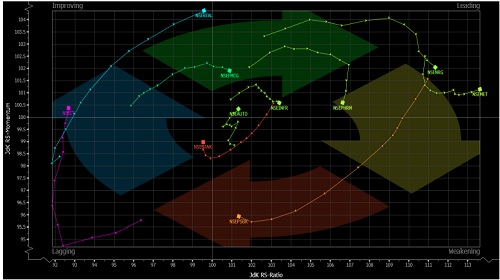
Relative rotation graphs chart shows the relative strength and momentum for group of Stocks/ Indices. It allows us to compare a security against the benchmark to see if it is outperforming or underperforming the benchmark. It is derived on Relative strength in which value of a sector is divided by the value of index mainly a benchmark which allows us to compare the performance of the sector. Relative Strength ratio is normalized to oscillate around 100 (plotted on X axis) i.e Jdk RS- Ratio along with this it provides the speed and direction of the Relative strength ratio (plotted on Y axis) i.e Jdk RS- momentum. The scatter plot is divided into four quadrants i.e Leading, Weakening quadrant, Lagging and Improving quadrant.
The analysis of sectoral RRG shows that Nifty Pharma, Infra, Energy, Metal and FMCG are in the Leading Quadrant, which indicates strength going ahead. Nifty PSU banks is placed in the Weakening Quadrant, suggesting that momentum is likely to decline. Nifty Bank is placed in the Lagging Quadrant, which shows that both strength and momentum are missing. Nifty IT and Realty are in the Improving Quadrant, indicating that strength is still low but momentum is gradually improving.
Investment in securities market are subject to market risks, read all the related documents carefully before investing.
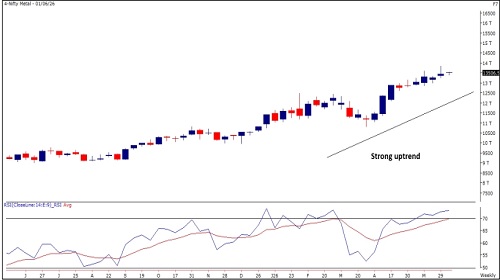
Nifty Metals Index
The Nifty Metals Index is currently retesting its significant multi-month breakout zone and is trading near 13500 marks. Sustaining above this level will be crucial to validate the breakout and maintain the positive trend. The index continues to trade above its key 10, 20, 50, 100 and 200 DEMA, indicating strength across multiple timeframes and reinforcing the underlying bullish bias. A successful hold above the breakout zone could pave the way for the next leg of the up move. Technically, the index is well-positioned to advance towards 14200 and 15000 levels in the coming months. Key support levels are placed at 12800 and 12450, which are expected to act as important demand zones.
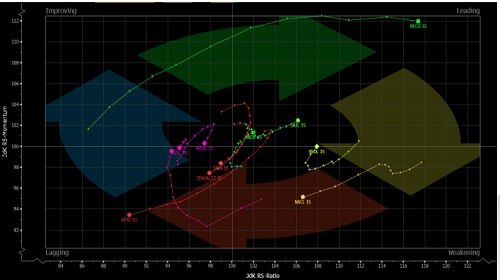
RRG For Nifty Metals
The analysis of RRG for Metal stocks shows that Welspun Corp, SAIL, Hindalco and Vedanta are in the Leading Quadrant, which indicates strength going ahead. National Aluminiumis placed in the Weakening Quadrant, suggesting that momentum is likely to decline. APL Apollo Tubes, Jindal Steel, Tata Steel and JSW Steel are in the Lagging Quadrant, which shows that both strength and momentum are missing. NMDC is in the Improving Quadrant, indicating that strength is still low but momentum is gradually improving.
Investment in securities market are subject to market risks, read all the related documents carefully before investing.
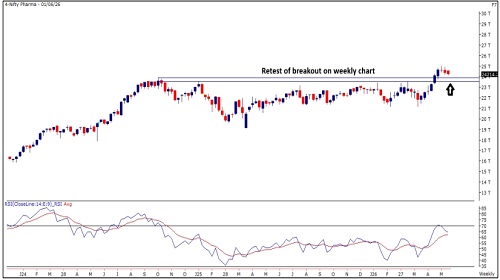
Nifty Pharma Index
The Nifty Pharma Index is currently retesting its consolidation breakout zone and requires a sustained move above 24800 levels to reaffirm the bullish momentum. The index has already delivered a strong rally from the lower levels and continues to trade above its key 10, 20, 50, 100 and 200 DEMA, highlighting a robust bullish structure across short, medium and long term timeframes. A decisive breakout above the immediate resistance zone is likely to attract fresh buying interest and accelerate the uptrend. Based on the prevailing technical setup, the index has the potential to advance towards 25600 and 26200 levels. On the downside, immediate support is placed at 23800, followed by a stronger support zone near 23300 zone
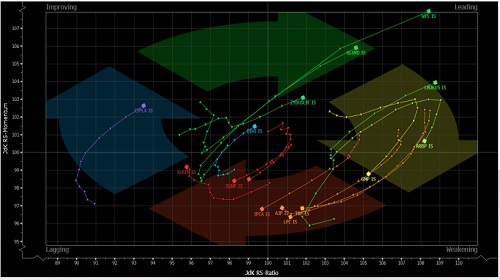
RRG For Nifty Pharma
The analysis of RRG for Pharma stocks shows that Zydus Life, Gland Pharma, Wockhardt, Laurus Labs and Aurobindo Pharma are in the Leading Quadrant, which indicates strength going ahead. Glenmark Pharma, Ajanta Pharma, Torrent Pharma and Lupin are placed in the Weakening Quadrant, suggesting that momentum is likely to decline. Sun Pharma and Alkem Laboratories are in the Lagging Quadrant, which shows that both strength and momentum are missing. Divi’s Labs and Cipla are in the Improving Quadrant, indicating that strength is still low but momentum is gradually improving.
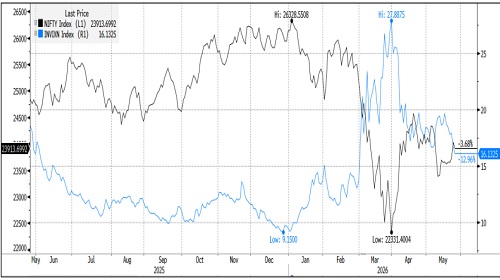
India VIX
India VIX decreased by 10.64% from 18.05 to 16.13 levels in the May series. It cooled off to 15 levels and paved way for the bulls for recovery from lower levels.
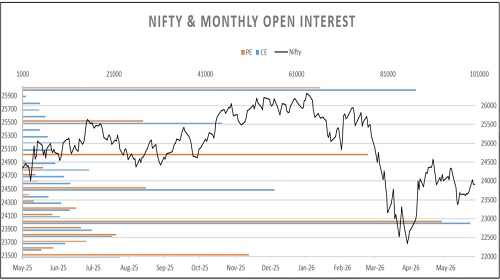
Nifty OI V/S Price
Rollover of Nifty stood at 70%, which is lower than the quarterly average of 72.3%. In the May series, open interest decreased by 1.5% while the index fell by 0.3% on an expiry-to-expiry basis, suggesting marginal long liquidation. Rollover in Bank Nifty stood at 75.3%, which is lower than its quarterly average of 80%. Bank Nifty ended the May series with losses of 0.6% with an increase in open interest by 21.1% indicating marginal short built up. Nifty begins the June series with open interest of 15.45 mn shares as compared to 15.68 mn shares at the start of the May series.
Nifty index began the May series on a positive note above 24k marks but after the strength in the initial week, it failed to cross 24500 zones and sunk lower by more than 1200 points. It took support near 23250 levels and witnessed a bounce towards the end of the series. On an expiry-to-expiry basis, Nifty formed a small bodied candle and an inside bar with longer wicks on either sides which suggests support based buying is intact but a decisive follow up is required in the index. Put Call Ratio based on Open Interest of Nifty started the series near 1.04 and oscillated between 0.76 to 1.26 levels to finally end the series at 1.07. On option front, Maximum Call OI is at 25000 then 24000 strike while Maximum Put OI is at 23000 then 23500 strike. Call writing is seen at 24000 then 23900 strike while Put writing is seen at 24000 then 23000 strike. Option data suggests a broader trading range in between 22800 to 24500 zones while an immediate range between 23000 to 24000 levels.
For More Research Reports : Click Here
For More Motilal Oswal Securities Ltd Disclaimer
http://www.motilaloswal.com/MOSLdisclaimer/disclaimer.html
SEBI Registration number is INH000000412


Tag News
Market Round-up - 14th July 2026 by Motilal Oswal Wealth Mangement


More News
Bank Nifty support is at 55000 then 54750 zones while resistance at 55555 then 55750 zones -...