


MOST Quantitative Outlook Monthly 04th November 2025 by Motilal Oswal Wealth Management

Bank Nifty
Bank Nifty witnessed a gradual up move and continues to contribute in the broader market rally lead by the PSU names. It went on to touch a new life time high of 58577 zones and closed near its higher band which suggests strength to continue. On the monthly scale, Bank Nifty formed a bullish candle and despite some profit booking and minor pullbacks, the index maintained above critical supports levels which reinforced resilient bullish sentiment. Price action suggests that a sustained hold above 57500 zones could open further upside move towards 58577 and then 59000 zones, while on the flip side, supports are placed at 57500 and then 57000 zones.

Nifty Energy Index
Nifty Energy Index has given a breakout from a symmetrical triangle pattern on the weekly chart, suggesting a potential continuation of the prior uptrend. The breakout has been accompanied by a sustained close above its 50 DEMA, further validating bullish sentiment. The RSI indicator has crossed above its average, confirming positive momentum build up. Thus, looking at overall chart setup we are expecting the sector to head towards 48590 and 49510 zones while on the downside support is at 44880 and 43960 levels.

Relative Rotation Graphs(RRG):
Relative rotation graphs chart shows the relative strength and momentum for group of Stocks/ Indices. It allows us to compare a security against the benchmark to see if it is outperforming or underperforming the benchmark. It is derived on Relative strength in which value of a sector is divided by the value of index mainly a benchmark which allows us to compare the performance of the sector. Relative Strength ratio is normalized to oscillate around 100 (plotted on X axis) i.e Jdk RS- Ratio along with this it provides the speed and direction of the Relative strength ratio (plotted on Y axis) i.e Jdk RS- momentum. The scatter plot is divided into four quadrants i.e Leading, Weakening quadrant, Lagging and Improving quadrant.
The analysis of sectorial RRG shows that Nifty Auto, Metal, and PSU banks are in the leading quadrant which indicates strength going ahead. Nifty Infra is in the weakening quadrant which suggests momentum is likely to decline. Nifty Realty, FMCG and Pharma are inside the lagging quadrant which shows strength and momentum both are missing. Nifty IT is under the improving quadrant which suggests strength is still low but momentum will start improving.

Nifty Auto Index
Nifty Auto Index has been consolidating after a sharp rally from its 20 WEMA and is now forming a tight range just below its recent swing high. The overall structure remains bullish as the index continues to hold above its short-term moving averages. The RSI indicator, while cooling off from overbought territory, remains in the positive zone, indicating underlying strength. Thus, looking at overall chart setup we are expecting the sector to head towards 28150 and 28880 zones while on the downside support is at 26000 and 25470 levels.

RRG For Nifty Auto
The analysis of RRG for Auto Index shows that Maruti, Hero Motoco, TVS Motors and Eicher motors are in the leading quadrant which indicates strength going ahead. Unominda and Bosch are under the weakening quadrant which suggests momentum is likely to decline. Sonacoms, Tata Motors, Bajaj Auto, Bharat Forge and Exide Ind are in the lagging quadrant which shows strength and momentum both are missing.

Nifty CPSE Index
Nifty CPSE Index is approaching a crucial breakout zone around its previous swing high near 6700 levels. The index has formed a series of higher lows and is trading above its 50 DEMA, reflecting accumulation at lower levels. Momentum indicators such as RSI are trending upwards and have moved above their signal line, confirming improving strength. Thus, looking at overall chart setup we are expecting the sector to head towards 6945 and 7080 zones while on the downside support is at 6415 and 6285 levels.

RRG For Nifty CPSE
The analysis of RRG for CPSE Index shows that NLC India is in the leading quadrant which indicates strength going ahead. Bharat Electronics is under weakening quadrant which suggests momentum is likely to decline. SJVN, Cochin Shipyard, Oil India and Powergrid are inside the lagging quadrant which shows strength and momentum both are missing. ONGC and NHPC are under the improving quadrant which suggests strength is still low but momentum will start improving.

India VIX
India VIX increased by 8.05% from 11.06 to 11.95 levels in the October series. It briefly crossed 12.7 levels, sparking short-term swings and intraday volatility. Despite these intermittent upticks, the overall subdued volatility range continues to offer comfort to the bulls, suggesting a relatively stable market sentiment ahead.

Nifty OI V/S Price
Rollover of Nifty stood at 75.8%, which is lower than its quarterly average of 80.7%. In the October series, open interest fell by 16.6% while the index rose by 5.4% on an expiry-to-expiry basis, suggesting short covering which could lead to fresh longs adding in the November series. Rollover in Bank Nifty stood at 79.6%, which is in line with its quarterly average of 79.6%. Short covering was seen as open interest decreased by 7.6% and price was up by 6.6% on an expiry-to-expiry basis. Nifty begins the November series with open interest of 15.17 mn shares as compared to 18.18 mn shares at the start of the October series. Open interest activity in Nifty has decreased with increase in price suggesting short covering which triggered the index to soar near its all-time highs.
Nifty index began the October series on a firm and optimistic note, maintaining its upward trajectory throughout the month with a sustained rally of about 1500 points. It managed to surpass the 26100 mark and moved closer to its all-time high territory, finally settling near the upper end of the range. On an expiry-toexpiry basis, Nifty formed a strong bullish candle, reflecting renewed confidence and a decisive comeback by the bulls, supported by active participation across key sectors and positive market sentiment. Put Call Ratio based on Open Interest of Nifty started the series near 1.18 and oscillated in between 0.76 to 1.38 levels to finally end the series at 0.98. On option front, Maximum Call OI is at 26000 then 27000 strike while Maximum Put OI is at 26000 then 25000 strike. Call writing is seen at 26000 then 26500 strike while Put writing is seen at 25500 then 25800 strike. Option data suggests a broader trading range in between 25000 to 27000 zones while an immediate range between 25500 to 26500 levels.

Option Strategies
NIFTY
* Nifty index witnessed a strong rally during October and is comfortably holding at higher levels.
* It has formed a strong bullish candle on the monthly timeframe and appears poised to surpass its previous lifetime high.
* Maximum Put OI is gradually inching higher and now stands at the 26000 strike, while Call OI is concentrated near the 26500 zone.
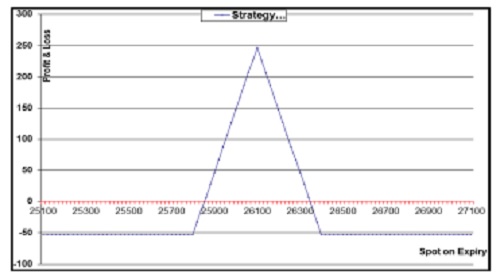
* This setup suggests deploying a Bull Call Butterfly Spread to capitalize on the ongoing upside momentum along with a likely decline in volatility.
BUY 1 LOT OF 25800 CALL
SELL 1 LOT OF 26100 CALL
SELL 1 LOT OF 26100 CALL
BUY 1 LOT OF 26400 CALL
Margin Required : Rs. 85,000
Net Premium Paid : 50 Points (Rs. 3750)
Max Risk : 50 Points (Rs. 3750)
Max Profit: 250 Points (Rs. 18750)
Lot size : 75
Profit if it remains in between 25850 to 26350 zones.
Bank Nifty
* Bank Nifty index is in strong uptrend and gave range breakout on monthly scale with strong bullish candle.
* Index is forming higher low structure on weekly scale as bigger trend is positive with overall buy on dips stance.
* Maximum Put OI is intact at 58000 levels while Call OI is at 60000 strike.
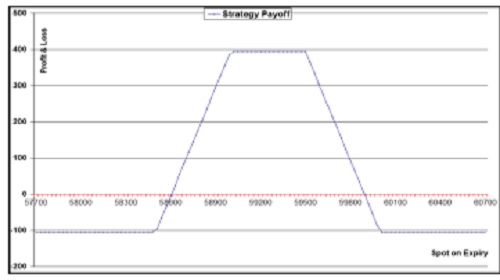
* Thus suggesting Bull Call Butterfly Spread to play the upside momentum with decline in volatility.
BUY 1 LOT OF 58500 CALL, SELL 1 LOT OF 59000 CALL,
SELL 1 LOT OF 59500 CALL, BUY 1 LOT OF 60000 CALL
Margin Required : Rs. 85,000
Net Premium Paid : 115 Points (Rs. 4025)
Max Risk : 115 Points (Rs. 4025)
Max Profit: 385 Points (Rs. 13475)
Lot size : 35
Profit if it remains in between 58115 to 59885 zones.
For More Research Reports : Click Here
For More Motilal Oswal Securities Ltd Disclaimer
http://www.motilaloswal.com/MOSLdisclaimer/disclaimer.html
SEBI Registration number is INH000000412


.jpg)
More News
MOSt Market Roundup : Nifty future closed positive with gains of 0.70% at 25181 levels by Mo...