Morning Bell 28th April 2026 by Bajaj Broking
Nifty Outlook
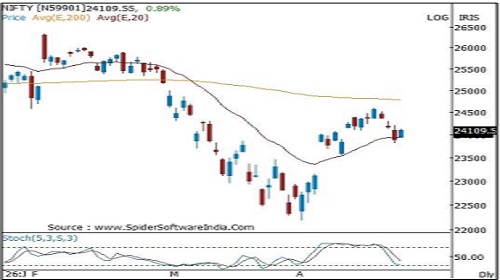
Index formed a bullish candlestick pattern which remained contained inside previous session price range signaling consolidation and buying demand emerging from near the 20 days EMA .
Nifty on expected lines is witnessing consolidation in the broad range of 23 ,600 - 24 ,400 amid stock specific action as we progress through the quarterly earning session .
Within the consolidation a move above Friday’s high of 24 ,206 will open further upside towards the upper band of the range placed around 24 ,400 levels . On the lower side a breach below last week low of 23 ,813 will open downside towards the 23 ,600 levels .
Short - term support is positioned around 23 ,600 –23 ,500 range being the confluence of the recent major low and 38 .2% retracement of the last 3 weeks pullback (22 ,183 - 24 ,601 ).
Intraday Support & Resistance
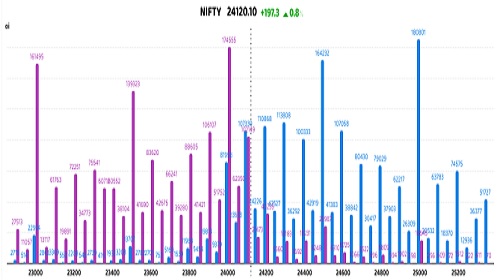
* Nifty Futures are trading higher by ~0.8%, sustaining above the key psychological level of 24,000
* Highest Put OI addition is seen at 24,000, followed by 24,100, indicating strong base formation by put writers ? Simultaneous call and put writing is observed at 24,100, highlighting it as a critical pivot level
* Put writers are actively positioned below 24,100, while call writers are concentrated above 24,100
* Max Pain is placed at 24,100, reinforcing it as the near -term equilibrium zone
* While the setup appears bullish in isolation, caution persists due to monthly expiry dynamics, elevated crude oil prices near $108, and lack of aggressive FII short covering
* With the highest Put OI at 24,000, the index is likely to trade in the 24,000 –24,300 range during the monthly expiry, unless this base is breached
* A decisive break below 24,000 may trigger downside towards 23,800 ? On the upside, a sustained move above 24,300 could lead to a positive gamma - driven expansion
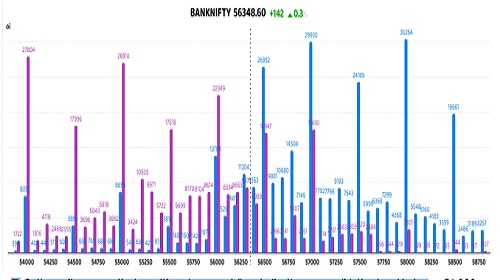
Bank Nifty Outlook
Index formed a second consecutive high wave candlestick pattern with a higher high and a higher low signaling consolidation and buying demand emerging from near the 20 days EMA.
Nifty on expected lines is witnessing consolidation in the broad range of 54 ,500 - 57,500 amid stock specific action as we progress through the quarterly earning session of the banking stocks .
Within the consolidation a move above last two sessions almost identical high of 56 ,475 will open further upside towards the 57,000 and 57,500 levels in the coming sessions . On the lower side a breach below last week low of 55 ,750 will open downside towards the 54 ,500 levels.
From a short -term perspective, support is placed in the range of 54 ,500 –54 ,000 zone, being the confluence of the recent low and 38 .2% retracement of the last 3 weeks pullback (49 ,955 - 57,456 ).

Intraday Support & Resistance
* Option writers are actively positioned across strikes, indicating a consolidation band between 56,000 and 56,500
* Max Pain stands at 56,100, while futures are hovering near 56,300, suggesting scope for gamma - driven activity within this band
* Ongoing range compression ahead of expiry signals a potential range expansion move
* A breakout on either side could result in a sharp directional move, driven by aggressive unwinding
* There is a strong likelihood of option writers getting trapped, which may further accelerate gamma - led momentum
* The overall bias remains positive as long as Bank Nifty sustains above the key support level of 56,000.
Above views are of the author and not of the website kindly read disclaimer