Monitoring Factors Impacting Income Growth Critical to Spur Consumption by CareEdge Ratings
Introduction
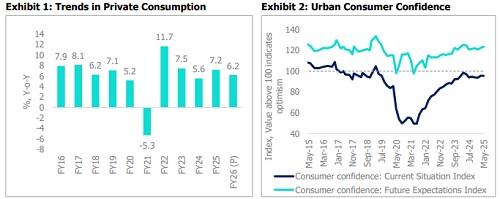
While overall consumption growth has remained broadly healthy over the past few years (Exhibit 1), recent indicators suggest emerging pressures in urban demand, even as rural demand continues to hold firm. Rural consumption is expected to be supported by favourable agricultural output and easing inflation in FY26. In contrast, the outlook for urban demand remains mixed, with data pointing to subdued wage growth. While the government and the corporate sector have been on a deleveraging cycle, overall leverage in the household sector has increased significantly. The two sectors undergoing deleveraging—the general government and corporations—are also key sources of employment and household income through wages, transfers, and subsidies. A simultaneous deleveraging cycle in both these sectors may have adverse implications for household income. This, in turn, can impact private consumption, specifically urban consumption.
However, recent policy support in the form of RBI rate cuts, reduced tax burdens, and easing inflationary pressures is expected to offer some relief and support to urban consumption in the near term. Moreover, rural consumption could get a further fillip from the likelihood of a good monsoon this year. In this report, we examine the factors putting pressure on private consumption and the likely course going forward.
Consumer Sentiments Remain Muted
It is important to note that consumer sentiments have remained weak since the pandemic. As per RBI survey, the Current Situation Index (CSI) of urban consumer confidence—which reflects perceptions of current economic conditions, employment, price levels, and personal finances—has recovered from the pandemic lows but remains in pessimistic territory (Exhibit 2). Rural consumer confidence has also improved and moved from pessimistic zone to neutral zone. As per this survey, the income perception of the rural and urban households remains weak, though there has been an improvement in the last few months.
Tale of Three Balance Sheets
In any economy, the government, corporations, and households represent the three primary stakeholders. An analysis of their debt profiles reveals a noteworthy divergence - while the government and corporate sectors have been undergoing a deleveraging cycle, household leverage has increased significantly (Exhibit 3).
Exhibit 3: Debt of household, corporations and government (% of GDP)
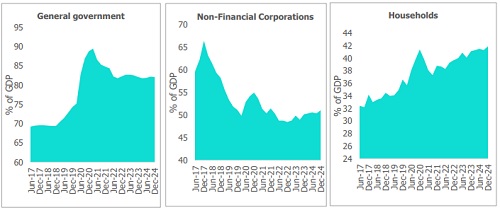
The deleveraging in the non-financial corporate sector began around 2017, with debt to the sector declining from a peak of approximately 66% of GDP in 2017 to an average of 50.5% in the post-pandemic period. This trend was further reinforced by the corporate tax reform in 2019, which allowed firms to reduce their debt.
Simultaneously, the general government sector also entered a deleveraging phase post-pandemic. After peaking at around 88% of GDP during the pandemic, government debt levels moderated to approximately 82% of GDP by December 2024. The reduction in government debt has been supported by fiscal consolidation and healthy nominal GDP growth.
In contrast, household sector leverage has steadily increased in the last few years. The debt of households rose from roughly 32% of GDP in 2017 to ~41% by the end of 2024, indicating a continued buildup of debt on household balance sheets, even as the other two sectors focused on consolidation. It is also important to recognise that the two sectors undergoing deleveraging—the general government and corporations—are key sources of employment and household income through wages, transfers, and subsidies. A simultaneous deleveraging cycle in both these sectors may have adverse implications for household income, particularly at a time when household balance sheets are increasingly leveraged. The reduced fiscal and corporate spending can weigh on income growth, further amplifying pressures on household demand.
Labour Cost Trends of Listed Non-Financial Corporations Indicate Muted Income Growth
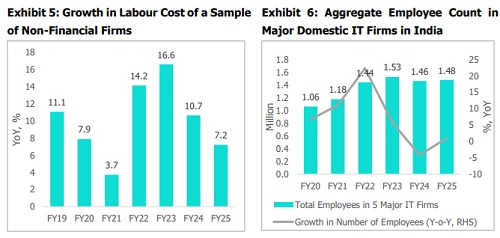
In this section, we examine a sample of 669 listed non-financial companies to assess trends in labour costs. Our analysis reveals that total labour costs for these non-financial firms grew by 7.2% in nominal terms in FY25—the slowest pace since FY19, excluding the pandemicdisrupted FY21 (Exhibit 5). The employee cost growth in FY25 is lower than the average growth of 10.7% over the FY19–FY24 period. This moderation is primarily driven by a sharp deceleration in labour cost growth within the IT sector. Six sectors—IT, Automobiles & Ancillaries, Infrastructure, Pharmaceuticals, Capital Goods, and Non-Ferrous Metals—together account for approximately 80% of the total employee costs in the sample (Exhibit 4). Sectoral trends in employee costs vary significantly. In FY25, some sectors saw employee cost growth outpacing nominal GDP growth, for example, Infrastructure (employee cost growth 13.7% YoY), Pharmaceuticals (11.2% YoY), and Capital Goods (10.9% YoY). In contrast, IT (4.9% YoY), Automobiles & Ancillaries (8.8% YoY), and Non-Ferrous Metals (2.5% YoY) recorded weaker growth in employee cost.
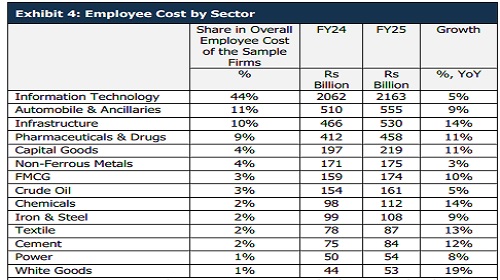
Given its scale and importance, the subdued salary growth in the IT sector raises concerns. The Indian IT industry is one of the largest employers within the organised non-financial sector, directly employing around 5.8 million individuals, according to NASSCOM. This is about 1.7 times the number of central government employees (~3.5 million). In our sample set, the IT sector accounts for nearly 44% of the total employee costs for the select sectors (Exhibit 4). The employee cost growth of the IT sector has fallen from the highs of 19% YoY in FY23 (annual average growth of 15% from FY19 to FY23) to 5% in FY25. The lower employee cost in the IT sector seems to be a combination of weak salary growth and muted headcounts. Our analysis of the top five domestic IT firms indicates a near-stagnation in headcount, following a 4% contraction in FY24 (Exhibit 6). The headcount growth was healthy in FY20-FY23, averaging 11.5% before contracting in FY24.

While employee costs of the corporates have remained subdued, average real wage growth (adjusted for CPI inflation) for employees has also been weak. The weak wage growth is evident from the Periodic Labour Force Survey (PLFS) data. Average real wage growth for regular wage/salaried employees contracted in both 2021 and 2022, before recovering modestly in 2023 and 2024. Similarly, real wage growth for casual labourers declined in 2023, followed by a marginal increase in 2024. Higher inflationary pressures in this period have contributed to muted real growth in wages in this period. However, subdued growth in real wages can have an adverse impact on private consumption demand.
Moderation in Income Growth Coincided with a Rise in Household Leverage
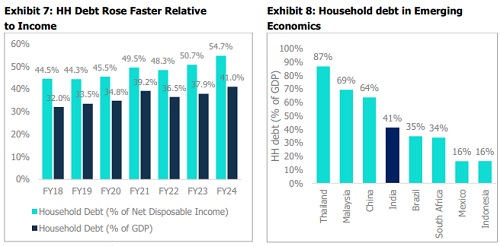
At a time when the income growth has been weak, the household leverage has seen an uptick. As of FY24, household debt stands at 41% of GDP and 55% of net household disposable income. Household debt remains on an upswing and is outpacing the relative growth in disposable income (Exhibit 7). Even though, Indian households are less leveraged than certain emerging economies such as Thailand (87% of GDP), Malaysia (67%) and China (62%), it remains higher than some other economies like South Africa (34%), Mexico (16%) and Indonesia (16%).
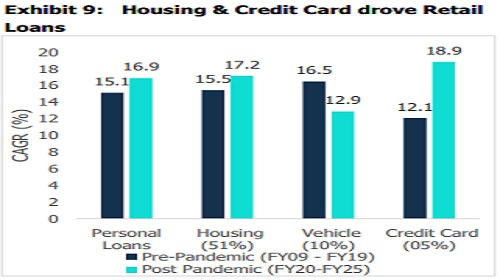
The rise in financial liabilities of households is primarily driven by the growth in housing and unsecured loans (Exhibit 9). There has been a structural change in the form of easy credit availability, leading to an increase in the number of households accessing credit. While unsecured loans have seen a significant recent increase and require close monitoring, housing loans have also remained the primary driver of household debts in the post-pandemic years. Household leverage allocated to real estate, in the form of residences and dwellings, is investment-driven, making it a more productive use of leverage. In fact, a household’s investment in the form of higher demand for real estate can complement public capex, pushing generating a higher multiplier effect on the whole economy. However, it is essential to closely monitor the unsecured segment of household liabilities, which has increased in the post-pandemic years. This is particularly important in the context of moderating income growth and rising delinquencies in the segment.
Outlook for Consumption
.Given that private final consumption expenditure constitutes nearly 60% of India’s GDP, it has a strong bearing on India’s overall growth outlook. A sustained recovery in consumption is also vital for a meaningful pick-up in private sector capital expenditure. Household income growth appears to have been muted over the past few years, and this trend could have implications for domestic consumption demand if it continues. Geopolitical risks and global trade policy uncertainties further add to the risk of muted export growth, with implications for household income and consumption.
Despite these risks, there are some factors supportive of consumption. Recent reductions in income tax burdens, benign inflation, lower interest rates, and a favourable outlook for agricultural production are expected to support rural incomes and bolster overall consumption. We expect private consumption growth of 6.2% in FY26 compared to an average of 6.7% in the last three years. In the long run, it will be critical to monitor factors impacting household income to ensure healthy growth in private consumption.
Above views are of the author and not of the website kindly read disclaimer


More News
Government notifies Income Tax Act 2025, to come into effect from April 1 next year