

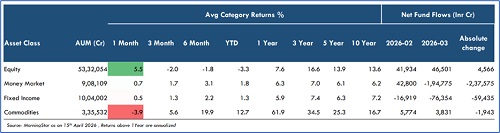
Money Market turns sharply negative while Equity sees steady inflows in March

Money Market: Net fund flows reversed sharply from Rs.42,800 Cr in February to - Rs.1,94,775 Cr in March, a steep decline of Rs.2,37,575 Cr (~-555%).
Fixed Income: Net outflows widened significantly from - Rs.16,919 Cr in February to - Rs.76,354 Cr in March, declining by Rs.59,435 Cr (~-351%).
Equity: Net fund flows improved from Rs.41,934 Cr in February to Rs.46,501 Cr in March, an increase of Rs.4,566 Cr (~+11%).
Commodities: Net fund flows declined from Rs.5,774 Cr in February to Rs.3,831 Cr in March, a drop of Rs.1,943 Cr (~-34%).
According to Vallum Capital’s Monthly Macro Grid Chartbook report, Total net asset-level flows reversed from Rs.73,589 Cr in February to Rs. - Rs.2,20,797 Cr in March. There was a massive outflow from Money Market (- Rs.1.95 lakh Cr in March), while Fixed Income continued to see sustained outflows, suggesting redemption pressure or sensitivity to interest rates. Inflows in commodities remained positive but subdued, suggesting cooling investor interest as momentum in precious metals stabilised.
Indian equities bounced sharply with Rs.59,629 Cr inflows (+ Rs.32,377 Cr vs Feb) — small-caps +8.1%, mid-caps +6.9%, large-caps +4.8% on a 1-month basis. But the YTD picture remains negative across the board (large-caps -6.2%, small-caps -3.0%), reflecting how severe the 2025 correction was. The recovery is real but incomplete.
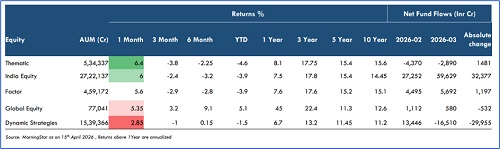
Fund flows reveal the true investor sentiment. Money is rotating into safety — large-cap funds absorbed Rs.28,558 Cr in March inflows, a Rs.19,242 Cr surge from February. Flexi-cap and mid-cap saw steady additions. Meanwhile, arbitrage funds haemorrhaged Rs.22,182 Cr in outflows (a Rs.22,713 Cr reversal), and dynamic strategies bled capital. Investors are staying in equities but retreating to quality and simplicity.
Within themes, the rotation is decisive. PSU funds lost Rs.4,498 Cr in March, and Consumption continued bleeding. Fresh money is flowing into Manufacturing (+ Rs.373 Cr, a Rs.634 Cr swing), Infrastructure (+ Rs.279 Cr), Defence (+ Rs.132 Cr), and Pharma (+ Rs.191 Cr) — a clear pivot toward domestic capex and healthcare as the preferred 2026 framework. On factors, offensive plays like Alpha (+8.5%), Momentum (+7.5%), and Growth (+6.5%) led the 1-month bounce, but over longer horizons, Quality and Low Volatility are holding up better, suggesting the rally is not yet broadly trusted.
Sitting atop the YTD Indian asset quilt: Gold +16% and Silver +16.45% — both outperforming every equity category year-to-date.
The dominant global theme is a weakening US dollar and a rotation away from American exceptionalism. The INR depreciated against virtually every major currency in April — Euro +4.1%, Brazilian Real +7.0%, Australian Dollar +3.2% vs INR in just one month. Over one year, the INR has lost 8–13% against most developed market currencies.
Country ETF returns confirm the rotation. Brazil (+17.1% in 1M, +76% in 1Y), Poland (+16.8%), South Korea (+16.1%), and Taiwan (+14.2%) are leading global markets. India's INDA ETF, at +3.7% in 1M and still -3% over 1 year, is participating in the EM recovery but not leading it. Emerging Markets ex-China are meaningfully outperforming, with the Global Miners ETF up +12.7% in 1M and +117% over 1 year, underlining the commodity Supercycle running alongside this rotation.
On thematic ETFs, the global winner is unambiguous — semiconductors and AI infrastructure. Invesco Semiconductors and First Trust Nasdaq Semiconductor ETFs both returned +22–23% in 1 month, while South Korea's AI Power Infrastructure ETF surged +22.4%. Cybersecurity and Chinese tech were the laggards.
Non-US equity, commodities, and domestic capex themes are outperforming in 2026. Gold and silver are structural, not tactical. Within India, Manufacturing, Infrastructure, and Defence have replaced PSU and Consumption as the cycle's preferred thematic — and the flow data confirms investors are already repositioning accordingly.
Above views are of the author and not of the website kindly read disclaimer


More News
Bulls and Bears : The market ends in the green; FIIs record outflows for the fourth consecut...


