

Market Volatility to Remain Elevated Amid Rising Oil Prices and Geopolitical Tensions - ICICI Direct

Nifty : 22600
Technical Outlook
Day that was ..
In the absence of any significant geopolitical development and the rising tide of crude oil prices dampened global market sentiment. Consequently, the Nifty pared its last week’s gains to settle at 22,600, down 2.4%. The broader market bore the brunt as the Nifty midcap and small cap indices plummeted by 6% and 7%, respectively. Notably, all major indices except for IT ended in the red, influenced by declines in sectors such as Metals, Defence, Realty, and FMCG.
Technical Outlook :
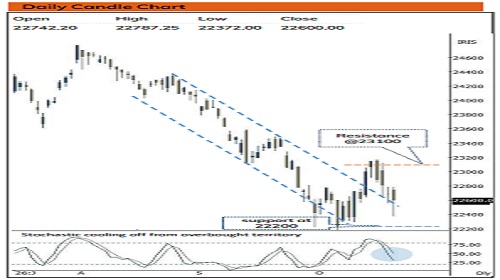
• Going ahead, we expect that volatility will remain elevated as geopolitical tensions escalate and crude oil prices rise ahead of the US Midterm elections. Since August, we have seen multiple failed pullback attempts. Therefore, we believe, for a meaningful pullback to materialise, index need to decisively close above 23500 mark which is 50% retracement of current decline (24774-22180) that coincides with downward sloping trend line. Otherwise, the corrective bias is likely to continue, with strong support being placed at 22200-21700 zone as it is 61.8% retracement of Oct-23 to Sep-24 rally (18838-26277) coincided with Apr26 low.
• Based on historical data patterns, including the magnitude and depth of the bull market correction, geopolitical risks, weakening momentum and breadth indicators, we believe the market is nearing its cyclical lows. Holding these lows would pave the way for a gradual recovery. Our thesis is based on following observations:
• Despite the ongoing global volatility, the Nifty managed to hold its ground above the long-term 200-week EMA. Historical data spanning the past 25 years reveal that, the median correction following breach of this key average has been limited to 3% (barring 2001, 2008, 2020). Buying during such panic periods has historically resulted in 10% returns in subsequent 3-6 months.
• Past 25 years, there have been eight instances where bull market corrections were arrested, with an average correction of 17%. Given that approximately 16% of the corrections have already occurred since Jan-26 high 26373, the market appears to be approaching its price-wise maturity.
• The Indian market had lagged its global counterparts due to AI-driven momentum. However, the recent global sell-off in AI-driven stocks, driven by concerns about Fed rate hikes and the financing of AI investments, could provide a supportive tailwind for the growth-oriented Indian market, potentially attracting FII’s in the near future.
• On the market breadth front, whenever more than 80% of the Nifty 500 universe trades below their 50-day and 200-day SMA, and the net advance-decline ratio indicates that only 30 stocks are in positive territory, it signals capitulated extremes. Historically, following these extremes, the index has delivered a median rally of approximately 23% over the subsequent 6-12 months. Currently, over 90% of stocks are trading below their 50-day EMA, and 73% are trading below their 200-day EMA, with 50 stocks trading positive for the day.
• Historically, these oversold conditions have offered optimal entry opportunity for constructing medium-to-long-term portfolios. Therefore, any signs of deescalation in geopolitical conflicts and a cooling of crude oil prices would likely result in a revival of momentum
Key Monitorables
• US Fed meet
• Crude Oil
• US 10 Year Bond yields
Intraday Rational :
Trend – Extended breather helped index to retest two months falling channel
Levels – Buy around Fridays low
Nifty Bank : 54287
Technical Outlook
Week that was :
Bank Nifty ended the week on negative note at 54287 down 2.8% on back of mixed global cues. However, the Nifty PSU Bank relatively outperformed losing 0.2% for the week.
Technical Outlook :
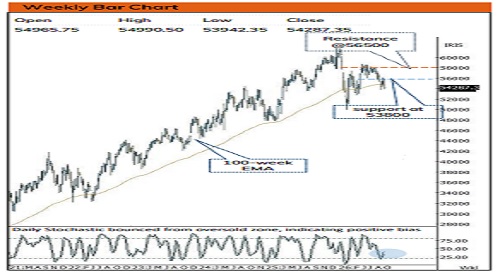
• The index opened the week on flat note and remained southward as intra-week pullbacks were short lived. The weekly price action formed is sizable bear candle with lower high lower low, indicating extended breather
• Index bias remains corrective as long as it forms lower high lower low formation. Index needs to decisively close above previous session high(54990) to pause the ongoing corrective phase. Current breather is seen as a healthy retracement as Index has retraced only 61.8% of current 6 days up move (54383-56065).
• Contrary to our expectation Index breached 54700 support and now next support is placed around 53800 levels being September lows. A decisive close 50 day EMA placed at 55900 would open door for extension of move towards 56,500 levels, coinciding with the 61.8% Fibonacci retracement of the recent decline and the 200-day EMA.
• NiftyPSU Bank Index has formed inverted hammer like candle and closed below 52-week ema with support placed around 7800-7860.
Intraday Rational :
• Trend - Supportive efforts from September lows
• Levels: Buy around Fridays low
Please refer disclaimer at https://secure.icicidirect.com/Content/StaticData/Disclaimer.html
SEBI Registration number INZ000183631









More News
Daily Market Insight - 26th October 2026 by Motilal Oswal Wealth Management