Individual AUM % share in MF AUM at 60% vs 40% for Institutional: Franklin Templeton India MF

Franklin Templeton India Mutual Fund has released a press note on the development in the Indian mutual funds industry. As per the press note, Indian Mutual Fund Industry’s Equity Funds AUM grew to Rs 36.18 lakh crore, vs Rs 32.10 lakh crore in May ’25, up 12.7% YoY. SIP AUM Rs 17.12 lakh crore vs Rs 14.61 lakh crore, up 17% YoY. SIP AUM to total Equity AUM % at 29% vs 27.9% YoY.+
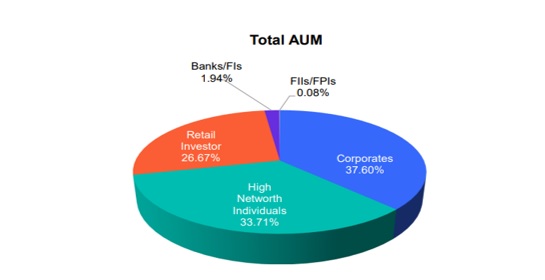
Individual AUM higher than institutional
Individual AUM % share in the AUM of the mutual fund industry rose to over 60% in May 2026, with HNIs accounting for 33.71%, retail at 26.67%, corporates, FIIs/FPIs and Banks/FIs own the remaining 40%.
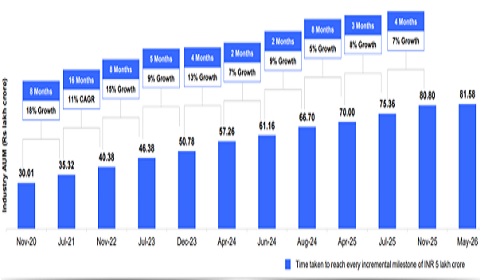
MF industry AUM at a high
The Indian mutual fund industry’s AUM stood at Rs 81.6 Lakh crore by the end of May ’26. The industry has added over Rs. 9.4 lakh crore to AUM over the past year. Industry AUM grew by 20% CAGR in the last 5 years & 19% CAGR in the last 10 years, ended May 2026
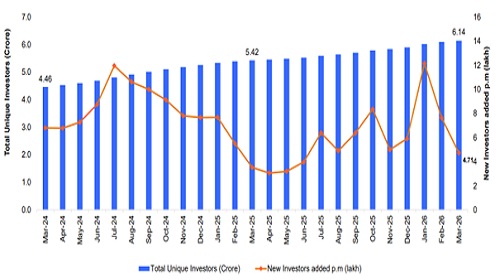
Total investor count
Total Investor Count Rose to 6.14 crore in March 2026. 4.71 lakh investors added in March 2026. 71 lakh new investors added in last 12 months vs 69 lakh in the same period last year.
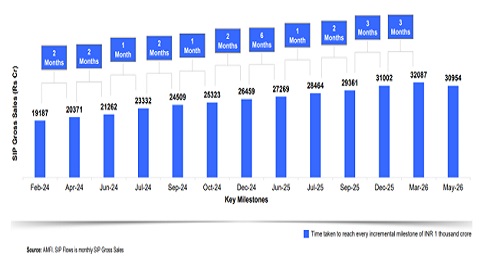
SIP flows over Rs 30,000 crore in May
The SIP flows stood at Rs 30,954 crore in May 2026; it doubled in less than 3 years. Monthly SIP flows (up 16% YoY) rose to Rs 30,954 crore in May ’26 vs Rs 26,688 crore in May ’25. SIP accounts rose to 10.47 crore in May ’26, up 15.6% YoY. The average SIP size up at Rs 2957 p.m. vs Rs 2947 p.m. last year.
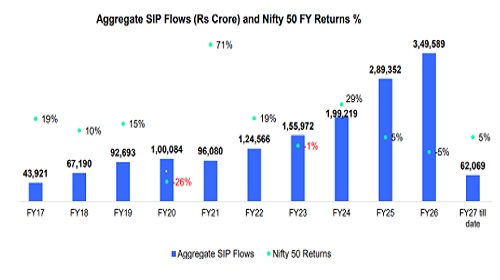
SIP flows
The SIP flows have risen despite weak market conditions. The aggregate SIP flows continue to rise despite volatile returns. It has been consistently rising since FY17, it touched almost Rs 3.50 lakh crore in FY26. In the two months of FY27 it has already crossed rs 60,000 crores. Aggregate SIP flows have grown ~ 7x at 26% CAGR between FY17 and FY26
SIP share of equity AUM at multi-year high
The SIP share of equity AUM moved higher to 29% in May 2026 from 27.9% a year ago. This is now a multi-year high level.
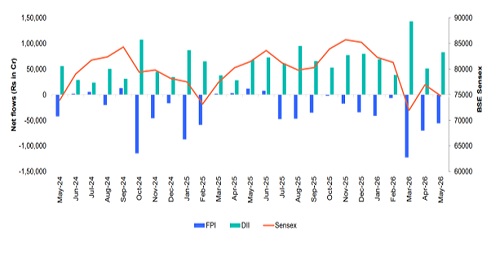
MFs a dominant force vs FPIs
Mutual Funds are now a dominant force vs FPIs. Net inflows for DIIs were Rs 8.9 lakh crore for last 12 months (till May 2026) vs Net outflows of Rs 4.7 lakh crore for FPIs.
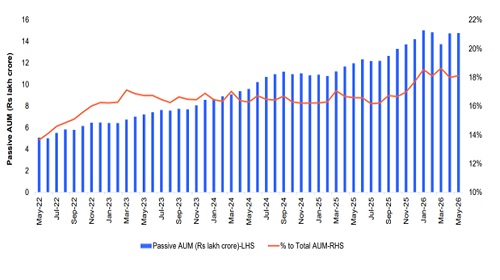
Passive AUM
Passive AUM stood at Rs. 14.77 lakh crore in May 2026 from Rs 11.97 Lakh crore a year ago (23% growth). The share of passive AUM rose from 14% of total AUM in May ’22 to 18% in May ’26.
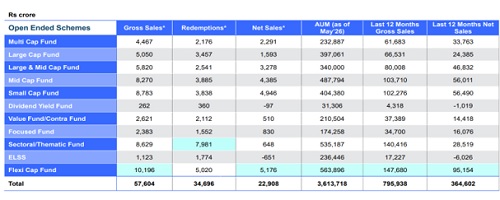
Flexicap funds
Flexi Cap Funds have topped net sales over last 12 months at Rs 95,154 crore, in the month of May alone it witnessed inflows of Rs 5176 crores. Most equity categories witnessed positive net sales in May 2026.
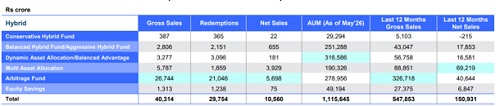
Multi Asset Allocation Funds in focus
Multi Asset Allocation Funds Top Net Sales Over Last 12 Months among hybrid funds. MAAF saw inflows of Rs 69,219 crores in the past 12 months, in May ’26 alone it saw inflows of Rs 3929 crores.
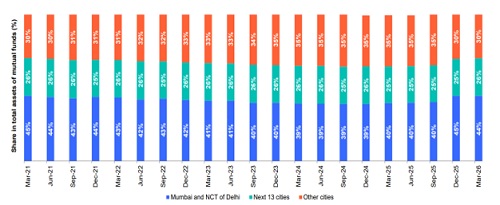
MFs moving beyond top 15 cities
Mutual Funds are moving beyond the Top 15 cities. The share of B15 cities rises from 29.6% in March 2021 to 29.8% in March 2026.
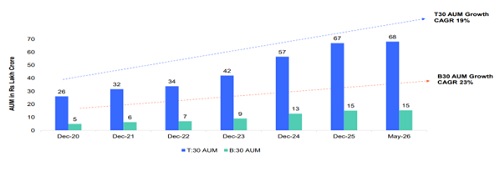
B30 locations AUM growth
The B30 locations’ AUM growth has outpaced T30 AUM growth. The AUM growth for B30 locations grew at 23% CAGR vs 19% for T30 locations. The share of B30 AUM in the industry AUM has increased from 16% in December 2020 to 18% in May 2026.