Index recovered after initial decline and settled the week on a positive note amid bouts of volatility - ICICI Direct

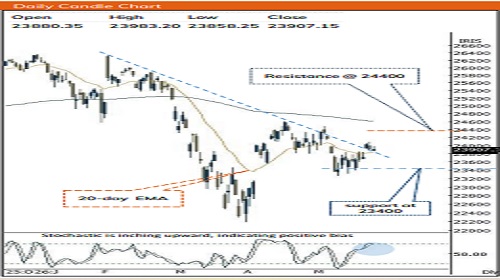
Nifty : 24056
Technical Outlook
Week that was .. • Equity benchmark settled the volatile week on a flat note wherein it managed to settle above the psychological mark of 24000. Nifty settled the truncated week at 24056, up 0.2%. Midcap’s relatively underperformed (down 1%). Sectorally, BFSI, Auto, Realty, Pharma remained in limelight while Metal, Energy underperformed.
Technical Outlook :
• The index started the week on a positive note and managed to close around the 100-day EMA (placed at 24,100), which has been acting as stiff resistance over the past four months. The weekly price action formed a "Doji-like candle" over second consecutive week, indicating heightened volatility around key levels.
• Going ahead, a decisive close and sustenance above 100 days EMA along with past two-weeks doji like candle’s high ~24200 would result in continuation of upward momentum towards 24800 in the month of July. Failure to do so, would result into prolongation of consolidation to prevail in the 24200–23600 range.
• Structurally, following a 1,100-point rally, the index has been stabilizing within the range of its 50-day and 100-day EMAs. This healthy consolidation has helped cool off overbought conditions, eventually strengthening the market structure and establishing a solid base for the next leg of the upmove.
• The elongation of rallies followed by shallow retracement underscores underlying strength that makes us revise support base at 23600. Hence, any decline should be used to accumulate quality stocks, as strong support holds at 23600 being gap support dated 12th June 2026 coincided with 50% retracement of June rally (23072-24189). Our Constructive bias is based on following observation :
a) Bank Nifty: After 3 months corrective phase, index closed above previous month’s high, confirming bullish reversal. Further, five years consolidation breakout on ratio chart of Bank Nifty vs Nifty signifies outperformance going ahead. Expect Bank Nifty to head towards 60000 in the near term
b) Mid/Small-Caps: Cup & Handle breakout on monthly chart of Midcap index augurs well for acceleration of upward momentum towards 70,000 (14% upside). While, 18 months falling trend line breakout in small cap index bodes well for catch up activity towards 22600 (20% upside)
c) Easing of geopolitical tension: Re-opening of Strait of Hormuz has triggered a sharp correction in Brent Crude Oil prices which is trading at three months low ($73). The softening of base metal prices along with falling crude oil is expected to moderate inflation pressure. Thereby key beneficiaries like Auto, OMC, Paint, Aviation, Realty would be in focus going ahead Key Monitorable : a) Auto Sales Numbers b) FII Inflows: The extended profit booking in these AI led indices may help to shift the FII’s interest from AI trade to growth oriented emerging markets like India c) US 10 Year Bond Yield: Retreated precisely from upper band of 3 years falling channel. Sustenance below 4.3% would provide highly supportive macro backdrop for emerging markets
Intraday Rational :
• Trend – Higher base formation at confluence of short-term 20 and 50-day EMA support, indicating near-term positive bias remain intact
• Levels – Buy around 61.8% retracement of 2 days range
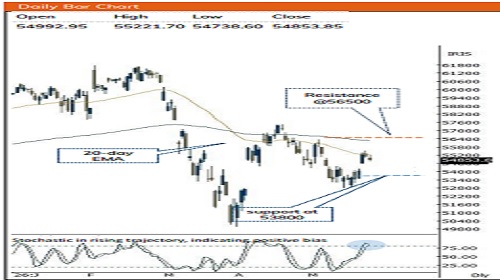
Nifty Bank : 58177
Technical Outlook
Week that was :
Bank Nifty Index closed the volatile week on positive note up 0.86% at 58177. Nifty PSU Bank relatively underperformed losing 0.83%.
Technical Outlook :
• Index recovered after initial decline and settled the week on a positive note amid bouts of volatility. The weekly price action resulted into high wave like candle with shadows on either side indicating elevated volatility.
• Key point to highlight is that, the ratio chart of Bank Nifty vs Nifty has witnessed breakout from a 5-years consolidation. This technical setup signals that the banking index is poised to accelerate its relatively outperformance and head towards 60000 in the coming month as it is gap-area formed on 2 nd March 2026
• The elevated buying demand highlights strength, thereby any decline towards 56200 should be capitalized as incremental buying opportunity as its placement of 200- day EMA coinciding with 61.8% retracement of current up move(55726-58021)
• PSU Bank Index has formed small spinning top like candle indicating breather after four weeks upmove. Going forward we expect Index to consolidate in range 8450- 8800 in coming sessions that would help to cool off the overbought conditions
Intraday Rational :
• Trend - Higher base above 200 days EMA signifies robust price structure
• Levels – Buy around 61.8% retracement of last 2 days range
Please refer disclaimer at https://secure.icicidirect.com/Content/StaticData/Disclaimer.html
SEBI Registration number INZ000183631