Index Rebounds Strongly, Forms Bullish Engulfing Candle - ICICI Direct Ltd

Nifty : 24335
Technical Outlook
Day that was ..
Equity benchmark regained last sessions lost momentum tracking decline in crude oil prices and settled Monthly expiry session at 24335, up 115 points. Midcap index reclaimed All-Time high after two weeks hiatus, up 0.5%. Barring Private banks and Metal, all other indices ended in green led by Pharma, Consumer Durable, PSU Banks.
Technical Outlook :
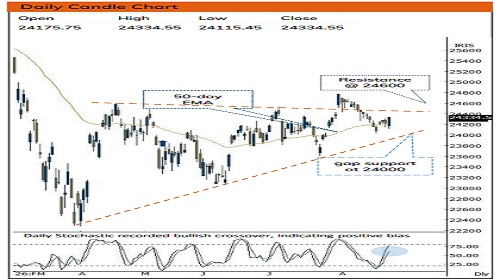
• Index started the session on a subdued note. However, fag end buying demand helped index to recover lost momentum and settle above previous sessions high. Consequently, daily price action resulted into sizable bull candle engulfing past three sessions trading range.
• Index is likely to witness gap-up opening tracking positive global cues amid fall in brent crude oil and cool off in US bond yield. Despite geopolitical uncertainty index continues to defend the four months rising trend line (24000), highlighting robust price structure. Thereby, we maintain our constructive stance and expect Nifty to resolve higher towards 24600 in the coming weeks. Key point to highlight is that, over past four months 24600 has been acting as key resistance. Hence a decisive close 24600 would open the door for next leg of up move. Accumulating quality stocks on dip would be the prudent strategy to adopt
• The Midcap index regained upward momentum after undergoing higher base formation above 20 days EMA. Meanwhile, Small cap index continues to hover in the vicinity of All-time high. The buoyancy in the broader market is further validated by improvement in the market breadth. Off April lows, Nifty has built a series of durable higher bases. Remarkably, market breadth (% of stocks above 200 DMA of Nifty 500 universe) at each base expanded sharply, moving from 19% to 38%, 48% and now at placed at 57%. This strengthening breadth amid geopolitical uncertainty clearly indicates that negativity is already priced in and now focus is on the stocks backed by strong earnings
• After staging a strong rebound from its four months rising trend line, Bank Nifty formed a higher base above its 200 days EMA, highlighting robust price structure which would propel Nifty to resolve higher as financials carries 36% weightage in Nifty
• Mirroring the historical rhythm off March peak of $120, Brent crude once again retreated from its 80% retracement of prevailing decline and now trading around $88. Falling crude oil would fuel the momentum in the Indian equities
Key Monitorable :
• US and India GDP
Intraday Rational :
• Trend – Strong buying demand from 4 months rising trend line confirms robust price structure
• Levels – Post gap up opening buy on pullback around Tuesdays
Nifty Bank : 57514
Technical Outlook
Day that was :
Bank Nifty ended the day on flat note at 57515 on back of mixed global cues on Monthly expiry day.
Technical Outlook :
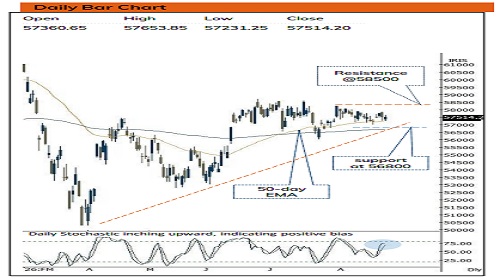
• Index started the week on negative note. However, found supportive efforts from previous session low indicating buying demand at lower levels. As a result, the daily price action formed Inside bar, indicating extended breather. • Amidst ongoing volatility, index has been finding support above its 50-day EMA which has been acting as support since 29th July 2026, indicating extended consolidation.
• Structurally, index stuck in the range 57000-57880. This healthy consolidation would set the stage to resolve higher and challenge the upper band of consolidation placed at 58500 in the coming week. In the process, strong support is placed around 56800 being the placement of four months rising trendline coincided with 100 days EMA
• Another observation is that over last 8 weeks Index has retraced by 38.2% of earlier 3 weeks rally, indicating slower pace of retracement which would help to set stage for next leg of rally.
• The PSU Bank Index formed bullish piercing line candlestick at 50-day EMA indicating buying demand from lower levels. Going ahead, follow through strength above last week (8744) high would open the door for next leg of up move towards 9100 levels
Intraday Rational :
• Trend - Prolongation of consolidation in vicinity of 50 days EMA, indicating positive bias
• Levels : Buy around Tuesdays close.
Please refer disclaimer at https://secure.icicidirect.com/Content/StaticData/Disclaimer.html
SEBI Registration number INZ000183631