Index is likely to witness positive opening tracking firm global cues - ICICI Direct

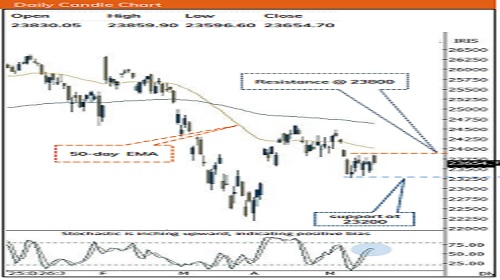
Nifty : 24013
Technical Outlook
Week that was .. Equity benchmarks extended gains over second consecutive week buoyed by easing of geopolitical concern, resulting into cool off in crude oil prices. The Nifty settled the week at 24013, up 1.7%. Meanwhile the broader markets relatively outperformed the benchmark with both Nifty Mid and Smallcap gaining 3% each for the week. Sectorally, barring IT, all major indices closed in the green, led by Defense, Consumer durables, Relaty
Technical Outlook :
• Nifty kicked off the week with a positive gap and gradually inched higher as the week progressed. In the Friday’s session, index pared some of the gains as minor profit boking emerged from 100 days EMA (24150). Consequently, the weekly price action resulted into high wave candle carrying higher high-low, indicating continuation of positive bias amid elevated volatility.
• Index is likely to witness positive opening tracking firm global cues. The breakaway gap coupled with a breakout from its 4-month falling trendline confirms trend reversal. This in turn suggest resumption of uptrend, paving the way for Nifty to head towards the milestone of 24500 in the coming weeks.
• Key point to highlight is that, past five sessions ~1100 points rally hauled daily stochastic oscillator into overbought territory (at 92), indicating temporary breather cannot be ruled out. However, such a breather would make the market structure healthier and eventually create a strong base for the next leg of the up-move. Hence any decline from hereon should be capitalized to build a medium-term portfolio by accumulating quality stocks with strong earnings as strong support is placed at 23400 Our Constructive bias is based on following observation :
• With past five sessions ~1100 points rally Nifty has entirely recouped past 12 sessions decline. The faster pace of retracement signifies structural improvement
• The ratio chart of Bank Nifty vs Nifty is at the cusp of breaking out from a 5-years consolidation. This technical setup signals that the banking index is poised to accelerate its relatively outperformance and head towards 59300 in the coming month.
• Brent Crude oil prices declined 8% and finally trading below its longterm 200-day EMA (placed at $82). Sustenance below this level would eventually help to reduce India's import bill, acting as powerful tailwind for Indian equities • The Midcap index is just 1% away from its All Time High, while catch up activity exhibited in the Nifty small cap which has logged a resolute breakout from 18 months falling trendline
• The current upmove is backed by improvement in market breadth as currently 65% of stocks within Nifty 500 universe are trading above their 50 days EMA compared to last week’s reading of 52%. Improvement in market breadth signifies broadening of rally
Intraday Rational :
• Trend – The breakaway gap coupled with a breakout from its 4- month falling trendline confirms trend reversal
• Levels – Buy around 61.8% retracement of Fridays range
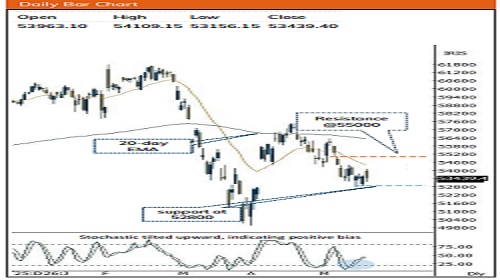
Nifty Bank : 57686
Technical Outlook
Week that was : Bank Nifty Index closed the volatile week on positive note up 1.5% at 57686. Nifty PSU Bank relatively outperformed gaining 2.2%.
Technical Outlook :
• Post gap-up opening on Monday ,Index seen breather in first two days and remained in northward journey and finally closed on a positive note. The weekly price action resulted into high wave like candle with higher high-higher low with gap below its base (56867-57076), indicating positive bias.
• Key point to highlight is that Ratio chart of Banknifty vs Nifty is on the verge of breakout from five-year consolidation indicating relative outperformance of BankNifty in comparison to Nifty. Additionally, Index has retraced past twenty-eight days decline in just 13 sessions, indicating faster pace of retracement. Going ahead we expect Index to gradually head towards target of 59300 levels in coming month as it is 80% retracement of Feb26-April26 decline
• Structurally, index has broken out of four months falling trend line, indicating conclusion of corrective bias that opens the door for next leg of up move. The formation of higher high-low on the weekly chart makes us revise support upward towards 56200 levels being 200-day EMA coinciding with 38.2% retracement of current up move(53027-58021)
• PSU Bank Index has formed high high higher low bull candle and close above its five weeks high while sustaining above 52-week EMA, signifying uptrend intact. It almost achieved our target of 8800 levels. Going ahead, we expect Index to form a higher base and set the stage to gradually head towards 9100 levels in coming weeks being April 2026 highs coinciding with 61.8% of Feb-April 2026 decline.
Intraday Rational :
• Trend - Index has taken 13 sessions to retrace past twentyeight days decline indicating faster pace of retracement.
• Levels – Buy around 61.8% retracement of Fridays range
Please refer disclaimer at https://secure.icicidirect.com/Content/StaticData/Disclaimer.html
SEBI Registration number INZ000183631