ICICI Lombard Q2 Results– Net Profit Jumps 18.1% to Rs.820 crores; Declares interim dividend of Rs.6.50 per share
PERFORMANCE FOR THE QUARTER AND HALF YEAR ENDED SEPTEMBER 30, 2025
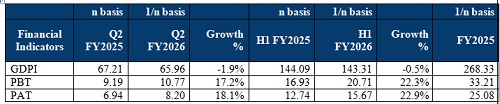
With effect from October 1, 2024, Long-term Products are accounted on a 1/n basis, as mandated by IRDAI, hence Q2 & H1FY2026 numbers are not comparablewith prior periods.
* Gross Direct Premium Income (GDPI) of the Company was at Rs.143.31 billion in H1 FY2026 compared to Rs.144.09 billion in H1 FY2025, a de-growth of 0.5%, as against the industry growth of 7.3%*. Excluding the impact of 1/n accounting norm, GDPI of the Company grew by 4.2% for H1 FY2026, as against the industry growth of 11.3%*. Excluding Crop and Mass Health, GDPI growth of the Company was at 3.5%, as against the industry growth of 10.5%* in H1 FY2026.
* GDPI of the Company was at Rs.65.96 billion in Q2 FY2026 compared to Rs.67.21 billion in Q2 FY2025, a de-growth of 1.9%, as against the industry growth of 5.9%*.Excluding Crop and Mass Health, GDPI growth of the Company was at 3.5%, as against the industry growth of 9.8%* in Q2 FY2026.
* Combined ratio was at 104.0% in H1 FY2026 compared to 103.2% in H1 FY2025. Excluding the impact of CAT losses of Rs.0.73 billion in H1 FY2026 and Rs.0.94 billion in H1 FY2025, the Combined ratio was 103.3% and 102.2% respectively.
* Combined ratio was at 105.1% in Q2 FY2026 compared to 104.5% in Q2 FY2025.Excluding the impact of CAT losses of Rs.0.73 billion in Q2 FY2026 and Rs.0.94 billion in Q2 FY2025, the Combined ratio was 103.8% and 102.6% respectively.
* Profit before tax (PBT) grew by22.3% to Rs.20.71 billion in H1 FY2026compared to Rs.16.93 billion in H1FY2025.
* PBT grew by17.2% to Rs.10.77 billion in Q2 FY2026compared to Rs.9.19 billion in Q2 FY2025.
* Capital gains was at Rs.6.16 billion in H1 FY2026compared to Rs.5.21 billion in H1 FY2025. Capital gains was at Rs.2.36 billion in Q2 FY2026compared to Rs.2.37 billion in Q2 FY2025.
* ???????Consequently, Profit after tax (PAT) grew by22.9% to Rs.15.67 billion in H1 FY2026compared to Rs.12.74 billion in H1 FY2025.
* PAT grew by18.1% to Rs.8.20 billion in Q2 FY2026 from Rs.6.94 billion in Q2 FY2025.
* The Board of Directors of the Company has declared interim dividend of Rs. 6.50 per share for H1 FY2026 as against Rs.5.50 per share for H1 FY2025.
* Return on Average Equity (ROAE) was at 20.8% in H1 FY2026 compared to 20.3% in H1 FY2025.
* ROAE was at 21.4% in Q2 FY2026 compared to 21.8% in Q2 FY2025.
* Solvency ratio was at 2.73x as at September30, 2025 as against 2.70x as at June 30, 2025 which was higher than the minimum regulatory requirement of 1.50x. Solvency ratio was at 2.69x as at March 31, 2025.
Operating PerformanceReview and Ratios
* With effect from October 1, 2024, Long-term Products are accounted on a 1/n basis, as mandated by IRDAI, hence FY2025, Q2 & H1 FY2026 numbers are not comparable with prior periods
Operating Performance:
Above views are of the author and not of the website kindly read disclaimer