Foresights September 2025 by CareEdge Ratings

Note From Sachin Gupta, Chief Rating Officer & Executive Director
GST reforms – A boost for consumption, but will it counter US tariffs? The government and the Reserve Bank of India have taken several steps over the past eight months to stimulate consumption in the economy. It started with the significant cut in income tax rates in the 2025-26 Budget, followed by an aggressive reduction in interest rates and liquidity easing by the RBI, and now, finally, this GST rate reduction.
All three steps are significant and expected to increase consumption, reduce inflation, and provide easier credit to the economy. The last two steps are likely to boost consumption further and potentially encourage private capital expenditures due to strong demand growth.
Impact of US Tariffs and GST rate cut
The impacts appear quite distinct at first glance. US tariffs primarily affect export-oriented industries, such as textiles, gems and jewellery, and shrimp. In contrast, tax reductions, including both the GST and income tax cuts, will have a more widespread impact and that too on the domestic front.
However, there is another perspective to consider. By reducing the GST (effectively by 8-10 percentage points) across most product segments, the government has made domestic prices of products more competitive compared to future imports. Essentially, as and when we sign our FTAs with the US and Europe, the domestic industry will be better positioned to compete with low-priced imports based on lower customs duties.
Additionally, it's worth noting that the Indian Rupee (INR) has depreciated by approximately 5% against the US Dollar (USD) over the past four months. The combined impact of the GST reduction and INR depreciation has given protection of nearly 13-15% to the Indian domestic manufacturers.
A push for consumption – But what next?
The GST reforms and rate cuts should definitely increase consumption in the economy, resulting in a positive impact on economic growth. However, questions remain about whether this growth will be sustainable. No, that’s quite unlikely.
Unless the government advances deeper reforms to enhance the ‘ease of doing business’, these improvements will be temporary. Our attention must shift to the more challenging reforms in land, labour, and agriculture, which are crucial for boosting our competitiveness globally. That indeed is the need of the hour.
Conclusion
The tariffs imposed by the US are undoubtedly unreasonable and unnecessary. Nonetheless, they seem to have a silver lining, as they are pushing the government to implement long-overdue reforms. Additionally, these tariffs are likely to motivate Indian companies to innovate and compete more effectively on the global stage.
However, I see one main risk, especially given the rapidly evolving geopolitical landscape. Instead of liberalising the Indian economy with significantly lower tariffs, India might choose to stay protectionist and inward-looking. That will be a lost opportunity. Recent government actions and statements suggest this is unlikely, but we will continue to monitor the situation.
Note From, Rajani Sinha, Chief Economist
India’s focus on growth amidst fiscal consolidation aids the Sovereign Rating Even while India goes through turbulence in the midst of US reciprocal tariffs, the credit profile of the economy remains supported. We have assigned a rating of BBB+ to India, with a stable outlook. This is one notch higher compared to S&P’s recently upgraded rating of BBB and two notches higher than that by Moody’s and Fitch
The global uncertainty and trade war have cast some shadow on India’s growth outlook in the near term. While India’s exports to the US are limited to around 2% of GDP, the country is now facing the highest US tariff rate at 50%. We have trimmed India’s growth outlook for FY26 to 6-6.5% depending on how soon they are able to reach some kind of trade deal with the US. Nevertheless, India remains the only large economy projected to record high growth of around 6.5% in the next five years, as per the IMF.
The government’s increased focus on physical and digital infrastructure bodes well for the future growth potential. The quality of government expenditure has improved, with the Centre’s capex as a percentage of GDP increasing to 3.2 in FY25 from an average of 1.7 in the five-year period pre-COVID. However, it will be critical for private investment to pick up meaningfully, for a sustained economic growth momentum.
As the external demand scenario remains uncertain, the government is looking at measures to boost domestic consumption. The reduction in income tax burden and GST rationalisation is likely to provide a fillip to domestic consumption. However, the Government needs to create enough jobs to provide a push to household income and ensure domestic consumption momentum.
On the external front, we estimate the export impact of a 50% US tariff at around 1% of GDP (annualised basis). However, India’s healthy services sector export, low global crude oil prices and strong remittances will continue to provide a cushion to the current account balance. While capital flows would remain volatile, India has ample forex reserves of USD 690 bn.
India has been on a fiscal consolidation path post the COVID shock. The estimated loss of revenue to the Centre from GST rationalisation is likely to be balanced by a higher-than-budgeted dividend transfer by the RBI to the Centre this year. Broadly, we feel the move towards fiscal consolidation will continue. India is one of the few countries globally that is expected to see a moderation in the government debt-to-GDP ratio. We estimate the general government (Centre+State) debt to GDP to fall from around 81% in FY25 to a 74% level by FY35. The other important aspect in favour of India’s sovereign rating is that a large part of the government debt is domestic in nature and hence not exposed to external vulnerabilities.
To put it in a nutshell, India’s sustained high growth, improvement in physical and digital infrastructure, robust external sector and stable financial sector give us confidence in the credit profile of the government. Political stability is another factor in favour of the country’s sovereign profile.
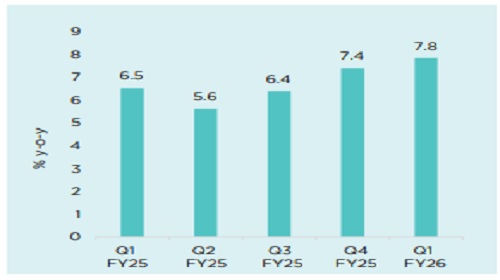
Q1 FY26 GDP GROWTH SURPRISES ON THE UPSIDE
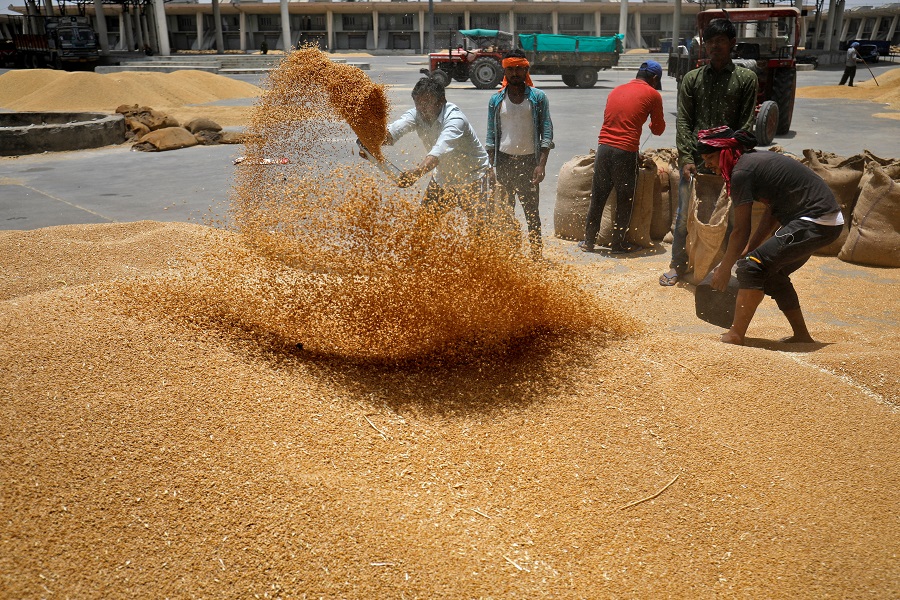
Q1FY26 GDP growth came in at 7.8%, well above our estimate of 6.6%. The robust GDP growth was led by a sharp growth in the manufacturing sector and strong momentum in the services sector. All three heads within the services - Trade, Hotels, Transport, and Commerce & Broadcasting Services (8.6% vs. 6%), Financial, Real Estate, and Professional Services (9.5% in Q1FY26 vs. 7.8% in Q4FY25), and Public Administration & Defence (9.8% vs. 8.7%) performed well. While the healthy momentum in the services sector was somewhat reflected by high-frequency indicators like strong growth in central revex, healthy services exports, growth in e-way bill collection and cargo traffic, the overall growth for this sector turned out higher than expected. Within the industry, the manufacturing sector posted higher growth (7.7% vs. 4.8%), likely supported by improving domestic consumption and the frontloading of imports by developed economies ahead of higher tariff implementation. This sharp rise in manufacturing is a positive development. However, the gains in manufacturing were partly offset by a sharp contraction in mining (-3.1% vs. 2.5%) and a moderation in utilities (0.5% vs. 5.4%), which capped the overall industrial growth. The early onset of the monsoon weighed on mining activity. Contrary to expectations, agriculture growth moderated in Q1 FY26 (3.7% vs 5.4%). However, a good monsoon along with robust Kharif sowing should support agricultural growth going forward. Overall GVA growth stood at 7.6% for Q1 FY26. The positive gap between GDP and GVA was in line with expectations, as growth in indirect taxes outpaced the growth in subsidies.
On the expenditure side, a key positive was the pickup in private final consumption expenditure (7% in Q1 FY26 vs. 6% in Q4 FY25), supported by the rationalisation of income tax slabs, easing food inflation, a favourable monsoon, and recent RBI rate cuts. The revival in domestic demand, despite global headwinds, is critical—not only for recovering private capex momentum but also for cushioning the potential loss of export market share amidst elevated tariffs. Additionally, government final consumption expenditure rebounded strongly, expanding by 7.4% in Q1 after contracting by 1.8% in the previous quarter. Interestingly, investment growth moderated but remained healthy in Q1. A strong uptick in central capex allocations, which increased by 52% in Q1 following a 33.4% growth in Q4, supported investment growth. On the external front, overall export growth (6.3% vs 3.9%) as well as import growth (10.9% vs -12.7%) recovered in Q1.
Quarterly GDP Growth
Way Forward
The Indian economy has been facing headwinds stemming from global trade policy uncertainties. The situation remains fluid and warrants close monitoring. Currently, Indian exports to the US are subject to a 25% tariff, with an additional 25% secondary tariff effective from August 27, raising the total tariff burden to ~50%. The postponement of the India–US trade negotiations further clouds the outlook. A 50% tariff on Indian exports to the US would place India among the most tariffed nations globally, alongside Brazil. Given the recent developments on the external front, we move our base case to US Tariffs at 25% on Indian exports. We remain hopeful that, via ongoing trade negotiations, the secondary tariffs on Indian imports will be removed. Under such a scenario, we expect GDP growth for FY26 to be 6.5% (base case scenario, with the removal of the additional 25% tariff). However, if the 50% tariff persists, there is a risk that growth will fall below 6%.
Overall, strong first-quarter GDP growth comes as a big boost in the midst of tariff-related uncertainties. However, the critical aspect would be sustaining this growth momentum. Given that the global trade scenario remains uncertain, domestic demand-enabling measures by the government would be critical in the coming quarters. From a monetary policy perspective, stronger growth reduces the likelihood of additional rate cuts. However, given that policy is forward-looking, the RBI will remain attentive to external developments. We do not anticipate further rate reductions unless downside risks to growth materialise. The expected rise in inflation in the second half of the fiscal year, as the favourable base effect wanes, is also likely to reinforce the RBI’s inclination to pause further rate cuts.
NEXT PHASE OF GST REFORMS & ITS MACRO-ECONOMIC IMPACT
The 56th meeting of the Goods and Services Tax (GST) Council was a major event in India’s indirect tax journey. It marked a major push towards simplification and rationalisation of the existing GST tax structure. The key outcome of the meeting was the introduction of a two-tiered GST tax structure of 5% and 18%, phasing out the currently existing 12% and 28% slabs. Furthermore, it introduced a special de-merit rate of 40% for sin goods and luxury items. The changes to the GST structure are aimed at boosting consumption, enhancing compliance and promoting the overall ease of doing business.
The changes in the GST rates will take effect from 22nd September 2025. However, the existing rates of GST and compensation cess (where applicable) on pan masala, gutkha, cigarettes, chewing tobacco products, unmanufactured tobacco and bidi will continue till loan and interest payment obligations under the compensation cess account are completely discharged. We expect the obligations to be met in the second half of FY26. However, the compensation cess will no longer be applicable on the rest of the basket.
Key GST Announcements
Agriculture & Related
* GST on agricultural goods (tractors and other machinery) lowered to 5% from 12%.
* GST rates on key fertiliser inputs such as Sulphuric acid, Nitric acid and Ammonia slashed to 5% from 18%. This is likely to correct the inverted duty structure in fertiliser sector.
Auto & Auto Parts
* GST on small cars, motorcycles (350cc & below) and three-wheelers is reduced to 18% from 28%. GST on buses, trucks and ambulances is reduced to 18% from 28%.
* Uniform 18% GST rate on all auto parts irrespective of their HS code.
* While the smaller vehicles are set to gain, motorcycles (above 350cc) and cars outside the small car definition have been moved to the 40% GST slab from 28% earlier. However, the cess imposed on luxury cars would be removed.
Electronics
* 18% GST on ACs, TVs (above 32 inches), dishwashing machines, etc compared to 28% earlier.
Textile & Labour Intensive Goods
* GST rate cut on man-made fibre from 18% to 5% and man-made yarn from 12% to 5%. This is likely to correct the inverted duty structure for the man-made textile sector.
* GST on labour intensive goods (such as handicrafts, intermediate leather goods etc) cut to 5% from 12%.
Everyday Essentials & Food
* GST rate on hair oil, shampoos, and other household articles cut to 5% from earlier 12%/18%.
* Zero GST on Ultra-High Temperature milk, all Indian breads, pre-packaged/labelled paneer.
* GST lowered to 5% on almost all food items such as packaged namkeens, chocolates, coffee, butter, ghee, etc. Earlier these items faced a GST rate of 12% or 18%.
Medicines & Medical Equipment
* Zero GST on select lifesaving drugs & medicines.
* GST on all other drugs & medicines slashed from to 5% from 12%.
* 5% GST on (a) Medical apparatus & devices and (b) Medical equipment and supplies
Hotel & Personal Services
* Hotel accommodation services (value of Rs. 7,500 per unit per day or less) to be subject to lower GST of 5% from 12% earlier.
* 5% GST on beauty and physical well-being services (gyms, salons etc) from 18% earlier
Insurance Policies
GST exemption to all individual life and health insurance policies with reinsurance. Currently, GST on life and health insurance premium stands at 18% with input tax credit. A. Impact on Economic Growth & Inflation The GST rationalisation is a timely and positive step to support economic momentum, particularly amid persistent external headwinds. By increasing disposable income, it is expected to stimulate private consumption while simultaneously easing inflationary pressures. We estimate that GST rationalisation could lower CPI inflation by 70–90 bps annually under the current CPI basket, assuming the pass-through to the consumers. Additionally, the forthcoming introduction of the new CPI series with a 2024 base year will be an important development to watch, as it may influence the estimated impact of the GST changes. A sustained recovery in private consumption will be critical—not only for reviving the private capex cycle in a meaningful way but also for supporting export-oriented sectors that risk losing market share amidst ongoing trade tensions. B. Impact on Government Finances & FY26 Fiscal Outlook The government estimates an annual shortfall of Rs 480 billion on account of the GST rationalisation. Based on certain assumptions, we estimate the net revenue foregone due to GST rate changes at around 0.4% of GDP1 at the general government level, on an annual basis. While the GST rationalisation is expected to result in some revenue loss, it is also expected to boost the buoyancy in tax collections. Since the changes are to be rolled out from September, the estimated impact for the current fiscal year is estimated to be roughly at 0.1% of GDP each for the Centre as well as the states. The impact on state finances is projected to be slightly higher, reflecting both changes in the GST collections of the states as well as the transfers from the Centre’s divisible tax pool. The revenue impact from GST rationalisation comes as at time when the Central government’s gross tax collections have already shown signs of slowing. During April–July FY26, growth in the gross tax collections slowed to 0.8% (y-o-y), sharply lower compared to the budgeted growth of 12.5%. This slowdown is particularly attributed to the sharply lower income tax collections which have weighed on the overall direct tax collections. Rationalisation of income tax slabs announced in the last Budget and increased tax refunds have weighed on the income tax collections so far. Stabilisation of refunds over the coming months could help improving the income tax receipts going forward. While direct tax collections lagged, indirect tax collections have been healthy in the year so far, supported by encouraging GST and union excise duty collections. However, custom duty collections have contracted sharply impacted by reduction in custom duty on certain items announced in the last Budget. The Union Budget pegged the nominal GDP growth at 10.1% for FY26, with an anticipated tax buoyancy of ~1. However, the nominal GDP growth is expected to be much lower at around 8% amid lower-than-expected inflation levels. This is expected to weigh on the tax buoyancy, thereby constraining the growth in tax collections.
Non-tax revenues grew by a robust 33.7% supported by strong RBI dividend. Even though net tax collections lagged, strong non-tax revenues lent some support to the growth in overall revenue receipts. On the expenditure front, the government has front-loaded capex, already meeting 31% of its annual budgeted target compared to 23.5% in the same period last year. Low gross tax collections and upbeat capex spending pushed the Centre’s fiscal deficit to close to 30% of the budgeted deficit in Apr-July 2025, higher than 17% last year.
We expect the net revenue shortfall from GST rationalisation estimated at ~0.1% of GDP for this fiscal year to be cushioned by the higher RBI dividend transfer. However, lower nominal GDP growth could pose some challenge for the tax collections this year. The income tax collections will be a critical monitorable in the coming months, given its subdued performance so far this year. Factoring all these aspects, the government expenditure could come under some pressure during the second half of the fiscal year if the government sticks to the fiscal consolidation path.
ASSESSING COUNTRIES’ VULNERABILITIES AND BUFFERS TO GLOBAL TRADE SHOCKS
In a new kind of playbook, the US is using tariffs to address its external imbalances. As of early August, its average effective tariff rate stood at 18.6%, the highest since the 1930s, according to Yale Budget Lab. Such elevated tariffs matter because they can influence trade and investment flows, adding to risks for global growth. The IMF projects global growth to slow to 3.0% in 2025 from 3.3% in 2024, well below the pre-pandemic average of 3.7%. While some US trading partners, like Japan, Korea, and the EU, have reached trade deals to limit the impact, India has yet to secure one. Meanwhile, the US and China have extended their trade truce. Questions remain over the legality of these measures, whether tariffs will extend to exempt sectors, and how transhipment will be handled. All this adds to uncertainty around global trade policy. Against this backdrop, CareEdge Global has developed a Global Trade Resilience Matrix to evaluate countries’ vulnerabilities to trade shocks and the macroeconomic buffers that can cushion them. Vulnerability is measured through trade openness, trade market concentration, export dependence on the US, and US tariff exposure. Buffers are assessed via economy size, government debt, and external metrics like import cover, external debt servicing and net international investment position. The framework covers 38 countries in our coverage universe, excluding the US, as it is the source of vulnerability, and groups them into four resilience profiles.
A. Most Trade Resilient Economies
* Includes Peru, Australia, Indonesia, Japan, the Philippines, the UAE, France, Germany, and the UK.
* These countries have the strongest of the four profiles and are relatively better positioned to withstand trade shocks.
* Germany and Japan benefit from reduced auto tariffs.
* The Philippines benefits from high services exports and remittances (10% of GDP), along with low external debt and low overall general government debt
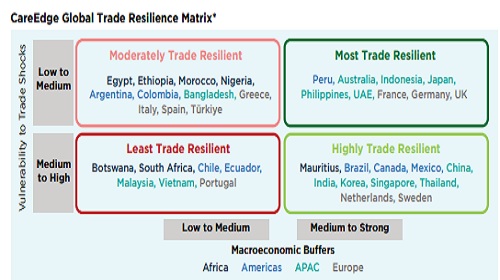
B. Highly Trade Resilient Economies
* Includes Mauritius, Brazil, Canada, Mexico, China, India, Korea, Singapore, Thailand, the Netherlands, and Sweden.
* This set of countries benefits from their available macroeconomic buffers to help them offset the impact of their trade-related challenges.
* Despite exposure to trade frictions, China’s resilience stems from its large economy, current account surpluses, low external debt (14.1% of GDP) and sizeable forex reserves, though elevated government debt remains a concern.
* India’s vulnerability is tariff-led, while Korea, Singapore, and Thailand are more exposed through trade openness and dependence on the US for goods exports (~6% of Korea’s GDP, 9% for Singapore, and 11% for Thailand, compared with just 2% for India). Buffers are generally strong, with all four countries benefiting from their economy size and low general government external debt. Overall external debt also remains low in India (19.5% of GDP, latest five-year average), Korea (33% of GDP), and Thailand (37%).
* In the Americas, Brazil faces steep tariffs but is cushioned by exemptions on key commodities. Mexico and Canada’s heavy reliance on the US is partly offset by protections under the US–Mexico–Canada Agreement
C. Moderately Trade Resilient Economies
* Includes Egypt, Ethiopia, Morocco, Nigeria, Argentina, Colombia, Bangladesh, Greece, Italy, Spain, and Türkiye.
* Even though the buffers available with this set of countries are limited, the fundamental vulnerability itself is contained and manageable.
* Bangladesh is relatively less exposed to global trade shocks due to low trade openness (31% of GDP). However, weak buffers are driven by low foreign exchange reserves and rising debt repayment obligations.
* Greece, Italy and Spain remain less cushioned due to their high levels of general government debt, ranging from 100-150+%. Since the Eurozone debt crisis, these countries have also accumulated substantial external debt. However, Greece’s direct US exposure is low, while Italy and Spain benefit from a diversified export base.
D. Least Trade Resilient Economies
* Includes Botswana, South Africa, Chile, Ecuador, Malaysia, Vietnam, and Portugal.
* This group represents the weakest resilience profile. These countries are the most vulnerable and have the least cushion against trade disruptions.
* Vietnam's exports to the US account for ~30% of GDP, the highest among the major US trading partners. This, combined with strong trade openness and uncertainty over tariffs on transshipments, increases Vietnam’s vulnerability. As a relatively medium-sized economy with a significant share of government external debt, its macroeconomic buffers remain moderately constrained.
* Malaysia has high trade exposure to the US (exports account for 10-11% of GDP). Its export profile is heavily concentrated in electrical and electronic products, particularly semiconductors. While semiconductors are temporarily exempt from tariffs, the sector remains vulnerable amidst tariff uncertainty. Additionally, Malaysia’s relatively moderate general government debt is elevated by contingent liability risks, and its medium-sized economy limits its capacity to absorb trade shocks.
In Conclusion
Our framework provides a structured, holistic lens to assess how countries are positioned in the face of the evolving US tariff measures. Our analysis shows that high tariff exposure does not necessarily place economies in the Least Trade Resilient quadrant. For instance, India and Brazil face steep US tariffs of 50% yet fall in the Highly Trade Resilient quadrant, supported by their relatively large economy size, low external government debt, and, in India’s case, particularly strong external buffers.
Secondly, it is important to note that a weaker position in the Global Trade Resilience Matrix does not necessarily imply a potential impact on existing sovereign ratings. For instance, Portugal may exhibit low resilience to trade shocks but maintains strong institutional and governance frameworks, which support a stable outlook
Overall, the matrix should be viewed as one input among several in assessing overall sovereign ratings. Moving forward, as global trade policies evolve, we will continue to monitor the latest tariff measures and key macroeconomic indicators to assess trade resilience.
DOMESTIC CELL MANDATE DELAY: RE GAINS, REGULATORS ON TRIAL
Revised timeline for the domestic cell mandate in projects
On December 9, 2024, the Ministry of New and Renewable Energy (MNRE) mandated the use of domestically manufactured solar cells under ALMM-II for all projects with bids finalised after this date. However, on July 28, 2025, MNRE introduced a “cut-off date” exemption, allowing bids concluded before this date to avoid the domestic cell requirement. This cut-off date was set one month after the release of the ALMM-II approved cell list on July 31, 2025, making August 31, 2025, the final date for exemption. As a result, bids between December 9, 2024, and July 28, 2025, likely included higher tariffs, as developers factored in the costlier domestic cells rather than cheaper imported Chinese ones.
The MNRE’s decision was likely driven by concerns over the ower-thanexpected installed capacity of domestically manufactured cells, which could have impeded the growth trajectory of renewable energy. CareEdge Ratings notes that this extension applies only to utility-scale projects. The original rules still bind open-access and net-metering projects and can use non-ALMM-II cells only if they were commissioned before June 1, 2026.
Rise in solar module capacity despite domestic cell shortages
India’s ALMM-I listed module capacity has more than doubled from ~38 GWp at the end of March 2024 to ~91 GWp at the end of June 2025 (108 GWp overall, including smaller and near-obsolete capacities as per CareEdge Ratings’ estimates), driven by strong demand for domestic modules. This growth is driven by strong domestic demand, aided by ALMM-I, the mandatory requirement of Domestic Content Requirement (DCR) modules in certain projects, and improved cost competitiveness of local manufacturers. The solar module industry has expanded rapidly due to its relatively simple, assembly-line nature and short payback periods for investors.
Conversely, solar cell manufacturing is far more complex and capital-intensive. China dominates this sector globally and has historically restricted technology transfer, equipment access, and skilled labour, creating high entry barriers. Despite this, India’s solar cell capacity has risen sharply from ~8 GWp at the end of March 2024 to ~27 GWp at the end of June 2025, owing to manufacturers’ focus on backwards integration for cost efficiency. However, cell capacity significantly trails module capacity, with actual domestic cell supply being lower than nameplate capacity due to sizable exports to the US, where tariff and non-tariff barriers protect against imports from China and Southeast Asia, India’s key competitors.
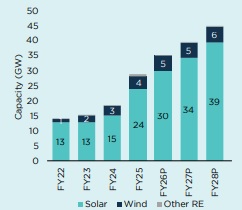
India installed 24 GW of solar capacity in FY25, and with a typical DC top-up of 30%, the total module offtake is estimated at ~31 GWp. CareEdge Ratings forecasts annual domestic solar additions of ~35 GW, implying an annual module requirement of ~45 GWp
RE Capacity Addition Trajectory
India’s Cell and Module Manufacturing Capacity as of June 2025 end
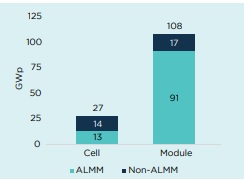
While some projects may use imported cells, many – especially those awarded after the cut-off date and DCR-mandated bids – must use domestically manufactured cells. Given the relatively low domestic cell manufacturing capacity, the Government has seemingly deferred timelines to avoid disrupting renewable capacity growth. Only 13 GWp of cell capacity is currently admitted under ALMM-II, indicating that nearly 50% of the installed capacity has yet to stabilise for listing.
Exhibit 2 above reflects the current capacity of solar modules and cells. While the difference appears to be significant, ~50 GWp of solar cell capacity is currently under implementation; however, it will become operational in a phased manner over the next few years. Projects awarded from December 2024 will have lower costs, leading to reduced tariffs Since December 09, 2024, India’s central renewable energy implementing agencies (REIAs) have awarded renewable energy (RE) capacity of ~12.0 GWAC by July 2025 end, encompassing hybrid and complex (round-the-clock (RTC) / Firm and Dispatchable RE (FDRE)) configurations. While the share of plain solar capacity reduced in 2025 due to a shift toward storage-based tenders, solar remains a major component of these projects. CareEdge Ratings estimates the solar component at ~11.1 GWAC, assuming a solar component at 0.6x for hybrid tenders and 1.5x for complex tenders.
DCR modules are currently priced at a premium of 4-5 cents/Wp compared to non-DCR modules, so developers have likely factored this extra cost into their bid tariffs for eligible projects. CareEdge Ratings estimates that replacing DCR modules with non-DCR modules, under the recent relaxation, could reduce the capital cost for the solar component by approximately ~?0.45 crore per MWp. For a plain solar project, this could lower tariffs by ?0.3-0.4 per unit from the originally determined tariffs. Hybrid or storage-based projects may also experience smaller tariff reductions due to the lower proportion of solar capacity in their configurations.
The ALMM-II timeline revision may cause uncertainty for projects awarded at higher tariffs between December 2024 and July 2025, leading to tariff renegotiations, potential cancellations, or regulatory approval challenges.
CareEdge Ratings View
“The ALMM-II framework revision helps sustain India’s renewable energy growth amid limited domestic cell supply, but brings challenges. Frequent policy changes create uncertainty for regulators and offtakers. Whether Renewable Energy Implementing Agencies can apply a reverse change-in-law interpretation remains unclear, potentially setting a new industry precedent,” stated Jatin Arya, Director, CareEdge Ratings.
“Furthermore, if these bids come up before regulators for a downward tariff revision, the situation could become more complex, as developers may contend that they have already placed orders with domestic suppliers, and reversing these could result in material losses. Even if such projects move forward, they are likely to face prolonged regulatory scrutiny and an extended gestation period before resolution,” Arya added.
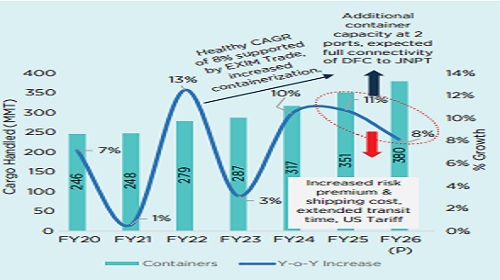
INDIAN CONTAINER CARGO TO GROW 8% IN FY26 DESPITE GLOBAL HEADWINDS
Global trade activity gets impacted by geopolitical and trade disruptions, and Indian ports are no exception. The United States (US) has imposed a 50% tariff on Indian imports, which has adversely impacted key export sectors, including home textiles, gems, shrimp, engineering components, and speciality chemicals. Despite mounting geopolitical tensions and trade disruptions, India’s container cargo sector is poised for resilient growth, with an estimated 8% increase in FY26, reaching approximately 380 million metric tonnes (MMT). CareEdge Ratings also estimates coal cargo volumes to decline by 3% owing to an increase in domestic coal production and a steady rise in the share of renewable energy.
Geopolitical Headwinds and Trade Volatility
Over the past three years, disruptions such as the Russia-Ukraine war, Panama Canal delays, and the Red Sea crisis have impacted cargo movement. In this fiscal, new flashpoints—including the Iran-Israel conflict and Operation Sindoor—further strained commercial shipping. Notably, tensions between India and Pakistan led to 6% drop in cargo volumes at Gujarat’s ports in May 2025.
On July 31, 2025, the US government announced the imposition of a 25% tariff on goods imported from India, effective August 7, 2025. Additionally, a 25% penalty tariff on trade with Russia took effect on
Container Volume Growth is likely to moderate by 100-150 bps due to US Tariffs
August 27, 2025. The tariff rates applicable to India are notably higher than those of other Asian countries. CareEdge Ratings expects a significant impact on segments such as home textiles, readymade garments, gems and jewellery, shrimp products, and engineering components and speciality chemicals, based on their export exposure to the US. India’s total merchandise exports for FY25 stood at USD 437 billion, with the US accounting for 20% of the total exports. It is pertinent to note that, on excluding electronic goods—which currently face no tariff—India’s sea-based merchandise exports to the US are estimated to represent around 5% of the total sea trade, indicating a moderate direct impact on overall cargo volumes
India’s container cargo achieved a robust 11% growth in FY25, reaching 351 MMT, surpassing earlier estimates. The sector’s compounded annual growth rate (CAGR) over FY23–FY25 stood at a healthy 8%, supported by buoyant EXIM trade, inventory rebuilding, and increased containerisation. Despite disruptions in major sea routes, the momentum remained strong. Going forward, the growth enabler will be new container capacity, the Expansion of 2.4 million TEUs at Jawaharlal Nehru Port Trust (JNPT) and 1 million TEUs at Vizhinjam Port. Furthermore, infrastructure Connectivity, marked by the slated connection of the Western Dedicated Freight Corridor (DFC), is expected to be fully connected to JNPT by December 2025. This will enhance port throughput as transhipment volumes rise.
However, challenges persist. Increased insurance premiums, volatile shipping rates and extended transit times are exerting pressure on margins and growth. Container volume growth in FY26 is estimated to moderate by 100-150 to 8% due to the impact of the US tariff on export volumes of affected sectors, which will be compensated mainly by capacity additions and increased transhipment activity
Rising Coastal Volumes Partially Offset Coal Decline Imports India’s coal production increased by 5% to 1,048 MMT in FY25, accompanied by a steady rise in the share of renewable energy in electricity generation—from 11% in FY22 to 14% in FY25. This shift has reduced dependence on imported coal, resulting in an approximate 8% decline in coal imports in FY25. Nevertheless, capacity additions on the eastern coast and increasing coastal coal volume thereof led to its healthy CAGR of 20% over FY22-FY25. This has partially offset the impact of the decline in coal imports. Consequently, coal volumes throughput witnessed a 3% year-on-year decline, reaching 388 MMT in FY25.
With a domestic coal production target of 1,150 MMT in FY26 and the continued growth in renewable energy’s share in the power generation mix, imported coal volumes are expected to fall further by 10% in FY26. The aforementioned impact will be partially offset by an expected 10% growth in coastal coal volumes during the same period. Overall coal volumes at ports are projected to fall further by ~3% in FY26. However, GoI’s plans to add large thermal capacities of 80 GW provide visibility for coal cargo in the long term. However, overall port volume growth is expected to ease at 2% in FY26 due to geopolitical instability and declining coal imports.
CareEdge Ratings View
“The Indian ports sector continues to navigate a complex global landscape marked by geopolitical conflicts and trade disruptions driven by US tariffs. According to CareEdge Ratings, the United States (US) accounts for only about 5% of India’s sea-based trade (excluding electronics). Consequently, container volume growth in FY26 is estimated to moderate by 100-150 bps due to the impact of the US tariff on export volumes of affected sectors, including home textiles, gems, shrimp, engineering components, and speciality chemicals. CareEdge Ratings estimates container volume growth in India at 8% in FY26, reaching ~380 MMT, supported by capacity expansion, rising transhipment activity, and the slated completion of the entire Western Dedicated Freight Corridor. Nonetheless, rising insurance costs, shipping rates owing to volatility in the SCFI and transit times are weighing on the sector’s growth trajectory,” said Maulesh Desai, Director at CareEdge Ratings.
“Overall coal volumes are estimated to decline by approximately 3% in FY26, driven by increasing domestic production and rising share of renewable energy in electricity generation. While reduced reliance on coal imports continues, healthy coastal volumes partially offset the decline,” he added.
USA'S 50% TARIFF HIKE THREATENS INDIA'S $10+ BILLION TEXTILE EXPORT
The Indian textile and apparel industry's size stands at approximately USD 160-170 billion, of which the domestic industry accounts for around 78-80%. India’s textile and apparel exports were ~USD 35 billion in CY24, with ready-made garments (RMG) and home textiles accounting for the majority share of around 63%. Following the Executive Order issued by U.S. President Donald Trump, a secondary tariff of 25% on Indian goods has taken effect as of August 27, 2025, due to India’s purchase of Russian oil, bringing the aggregate tariff to 50%. The textile industry is expected to be significantly affected by the additional tariff. Since the 50% tariff is in addition to the previous Most Favoured Nation (MFN) duty, the effective tariff on Indian textile products now ranges between ~52% and 64%.
Indian Textile Export ($ Billion) Country wise Indian Textile Exports ($ Billion)
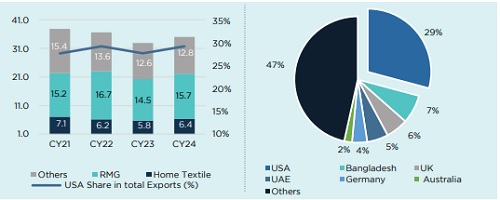
The USA has been the largest export market for Indian textiles and apparel, accounting for 28-29% of exports over the last four years ended CY24. India primarily exports cotton-based textile products to the USA, predominantly home textiles and apparel, which together accounted for ~90% of Indian textile exports to the USA in CY24. Besides the USA, the other key export markets for India’s textile sector are Bangladesh (7%), the UK (6%), the UAE (5%), and Germany (4%), among others.
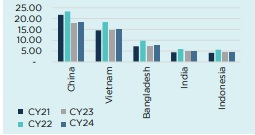
Top Exporting Countries to USA (RMG, $ Billion)
Top Exporting Countries to USA (Home Textile, $ Billion)
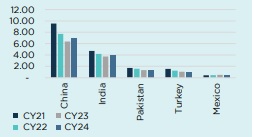
In the USA textile market, India competes with countries like China, Vietnam, Bangladesh, Pakistan, Turkey, Mexico, etc. In the short term, higher tariffs on textile imports from India would increase the cost of Indian textiles in the USA market, reducing their price competitiveness against other exporting countries. This increase in cost is likely to dampen demand for Indian textiles, potentially affecting export volumes.Competing countries, such as Vietnam, Bangladesh, Pakistan, and Indonesia, face secondary tariffs of 19-20%, whereas China’s secondary tariffs are currently capped at 30%. Consequently, orders for RMG are likely to shift toward these countries unless Indian exporters absorb through steep discounts. China has a tariff disadvantage compared to other exporting nations, but a lower secondary tariff than India. Some orders in home textiles may also shift to China if buyers can’t get Indian prices down. The effective tariff rates (Base duty + Secondary tariff) by the US for the import of textile products from China stand at ~46-52% compared to ~52-64% for India.
Impact on Indian Textile Export Until August 2025, Indian textile exports have largely remained unaffected, as tariffs were broadly in line with those of key competing nations. In H1CY25, India’s aggregate exports to the USA increased by ~7% over H1CY24, reaching USD 5.45 billion. Despite a likely shift in orders towards competing nations, Indian textile exports are not expected to decline materially in CY25, as some US buyers have also accelerated their shipments from India ahead of the expected August 27 tariff hike.
However, in CY26, Indian textile and RMG exports to the USA could decline significantly due to unfavourable tariff rates compared to competing nations and the expected decline in consumer demand driven by rising prices in the US market. This would be despite India’s strong foothold in the cotton-based textile value chain and its dominant position in the home textile segment, the limited capacity of competitors to meet quality and specific customer requirements for certain orders, and the benefit from the potential depreciation of the Indian Rupee. The expected decline in exports is likely to be compensated by an increase in exports to the UK, aided by the India-UK FTA, and ongoing FTA negotiations with the EU. The India-UK FTA is a game-changer for India’s RMG and home textile sectors, creating a level-playing field vis-à-vis key competing nations for accessing the nearly USD 23 billion UK import market. Moreover, the export loss of RMG and home-textile products is likely to be compensated by growth in exports of cotton yarn and fabric as the competing nations lack backwards integration in these products.
CareEdge Ratings View
CareEdge Ratings expects India’s overall textile export to decline by 9-10% in CY26 to USD 30 billion, considering the significant decline in exports to the USA. With anticipated loss of revenue and partial tariff absorption, PBILDT margin of Indian RMG and home-textile exporters is expected to decline by 300-500 bps. The growing demand from the domestic market may support the sector's profitability to a certain extent. The Government of India has removed 10% import duty on cotton till December 31, 2025. Additionally, expected support from the Government in the form of expanding export markets through its dedicated outreach programme to 40 nations, as well as export incentives and interest subsidies, can support the competitiveness and profitability of Indian textile exporters.
Above views are of the author and not of the website kindly read disclaimer


.jpg)