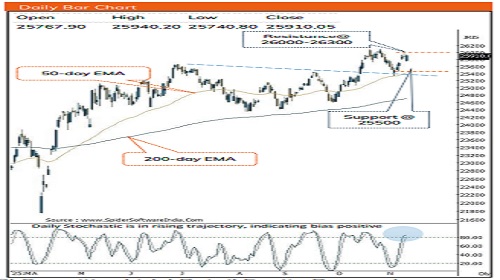
Equity benchmark resumed uptrend after two weeks breather and settled eventful week at 25910, up 1.64% - ICICI Direct

Nifty :25875
Technical Outlook
Week that was…
Equity benchmark resumed uptrend after two weeks breather and settled eventful week at 25910, up 1.64%. Midcaps continued with its winning streak, consequently clocking fresh All Time High after Sept-24. Beaten down IT, Defence and pharma staged a strong rebound meanwhile realty, FMCG continued with its breather.
Technical Outlook:
* Index kicked off the week with strength and sustained buying interest propelled Nifty higher through the week, resulting in a solid bullish candle that underscore improving sentiment and rising momentum strength.
* Index displayed resilience by providing buying demand in the vicinity of 50 days EMA and enabling the formation of higher base while sailing through global as well as domestic volatility. This makes us believe that, past three weeks consolidation has created launchpad for Nifty to challenge All Time High of 26300 in the coming month. Further, softer inflation reading along with better-than-expected Q2 earnings reinforces positive momentum that would drive index higher. Hence, any decline should be used as buying opportunity as strong support is placed at 25300 as it is 50% retracement of Sept-Oct rally (24588-26104) coincided with 50 days EMA.
Following observations makes us reiterate our positive stance:
* Political Boost: A decisive victory for the NDA in Bihar election has boosted the investors sentiment and augurs well for continuation of prevailing uptrend
* Bank Nifty: Past 10 sessions decline completely retraced back in just five sessions, Faster retracement signifies structural improvement
* Midcap: Midcap index challenged Sep-24 high and recorded fresh alltime high. The current up move is backed by improvement in market breadth as currently 68% of Midcap index stocks are trading above their 200 days EMA compared to one month back reading of 64
* Nifty IT vs Nasdaq: Defying the past two decades positive correlation with Nasdaq, the Nifty IT index has seen correction in recent past. Consequently, Nifty IT vs Nasdaq ratio has approached at two decades low. The current pullback in the ratio signifies mean reversion can be seen going ahead wherein Nifty IT would relatively outperform the Nasdaq in coming months
* Global Macros: US Dollar index and Brent crude have been inching downward that augurs well for emerging markets
Key Monitorable for the next week:
* With the Development of India-US tariff negotiations would be key monitorable
Intraday Rational:
* Trend- Structure remains uptrend-friendly above gap-area support(25715-25781)
* Levels- Buy on declines near 80% retracement of previous day upmove(25815-25980)
Nifty Bank : 58517
Technical Outlook
Week that was:
The Bank Nifty posted a new lifetime high after a 2-week pause, finishing the week at 58,517, up 1.11%. The Nifty Private Bank index also moved in sync, closing at 28,192 with a gain of 0.92%.
Technical Outlook:
* Bank Nifty began the week on a strong note and maintained steady buying traction through-out the week. As a result, weekly price action shaping a prominent bullish candle that reinforces the ongoing trend strength.
* Following three weeks of narrow consolidation, Bank Nifty has finally witnessed a decisive breakout, triggering a strong upward move and printing a fresh all-time high. The index wrapped up the week above the 58,500 zone, with the (PSU banks) has been outperforming, and private sector banks are expected to catch up which is shying away 2% from it all-time high, that could further support the ongoing upside momentum. Going ahead, a sustained strength above the 58,500 mark would open the door for the next leg of the up move towards the revised target of 60,000, which based on the measured move projection derived from the current consolidation range.
* At present, the index is hovering near record territory, with all key moving averages positioned in a northward slope, reflecting a firm bullish structure. Momentum readings further support this setup, as both daily and weekly RSI continue to hold in the bullish band, reinforcing confidence in the breakout. Hence, focus should be on accumulating quality stocks on dips backed by strong earnings as immediate support is placed near 56,900, being 61.8% retracement of the ongoing advance (55,727–58,577) and recent gap support.
* Historically, there have been 17 instances over the past two decades where Bank Nifty, following a decisive breakout above its previous two-month high, delivered double-digit returns within the subsequent four months. In the current setup, the index has once again confirmed a breakout above its prior two-month high and surpassed the previous all-time peak, reaffirming the prevailing bullish structure. This setup indicates a high-probability continuation pattern for sustained upside momentum in the coming months.
* The PSU Bank Index continues to outperform, maintaining a higher-high, higher-low formation for the eleven-straight week on the back of strong Q2 earnings. In near term, index is witnessing series of healthy consolidation after sharp up move. However, any dip from hereon should not be construed as negative instead capitalized it as buying opportunity in quality stock as strong support is placed near 7,800, aligning with the 38.2% retracement of the latest rally (6,730–8,391).
* Intraday Rational:
* Trend- Higher-high-low formation in the vicinity of 20-day EMA
* Levels: Buy on declines near 80% retracement of previous day upmove(58380-58690)
Please refer disclaimer at https://secure.icicidirect.com/Content/StaticData/Disclaimer.html
SEBI Registration number INZ000183631


Tag News
Monthly Choice :- Buy DELHIVERY in Cash @ 500.4 SL 470 TGT 560 by Choice Broking Ltd