EcoFlash - August IIP Up 4% YoY: Infrastructure and Mining Grow,Manufacturing Slows by Shalini Shirsat, Economist, Institutional Research, PL Capital

August IIP Up 4% YoY: Infrastructure and Mining Grow, Manufacturing Slows
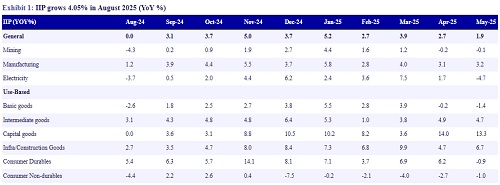
Index of Industrial Production (IIP) recorded 4.0% YoY growth in August 2025, slightly easing from the revised 4.3% growth in July. This indicates stable yet cautiously paced industrial recovery amid a complex economic environment. Growth was largely supported by a sharp rebound in mining output, improved electricity generation, and a strong surge in infrastructure and construction goods driven by sustained public capital expenditure. Meanwhile, manufacturing growth moderated to 3.8%, impacted by softness in consumer non-durables demand and a slowdown in capital goods production, reflecting cautious private investment. The mixed performance across use-based segments highlights ongoing sectoral divergences. Economically, data suggests that while macroeconomic fundamentals remain broadly supportive, challenges from subdued consumer demand, slower private investment, and external uncertainties could weigh on near-term industrial momentum. However, monetary easing, festive season, and fiscal push are poised to provide a strong boost to domestic consumption and industrial growth in the coming months.
Key Insights:
* Manufacturing growth moderates to 3.8%: Manufacturing output grew by 3.8% YoY in August, down from 6.0% in July. The moderation was primarily due to weaker demand in consumer non-durables, which contracted by 6.3%, signaling softness in essential goods consumption. Additionally, capital goods growth slowed to 4.4% from 6.8%, reflecting cautious private sector investment amid ongoing global uncertainties. Sectoral divergence also played a role, with some key manufacturing sub-sectors such as electronics and chemicals, remaining weak, which dampened overall growth as only 10 out of 23 manufacturing groups exhibited positive growth. Key growth drivers for manufacturing were basic metals (+12.2%), motor vehicles and trailers (+9.8%), and coke & refined petroleum products (+5.4%).
* Mining activity rebounds: Mining output rebounded sharply with 6.0% growth in August, after 7.2% contraction in July, reflecting recovery from earlier disruptions related to monsoon.
* Electricity output improves: Electricity generation grew by 4.1% YoY in August, reversing the decline seen in June and July, signaling strengthening power demand.
* Infrastructure & construction goods surge: The sector recorded strong growth of 10.6% YoY, underpinned by continued public capital expenditure and project execution, with cement and basic metals used in construction showing good performance.
* Use-based classification of India's IIP for August reveals mixed sectoral performance contributing to growth dynamics of the three main IIP components. Primary goods grew by 5.2% supported by strong output in basic metals, mining, and coke & refined petroleum products. Intermediate goods also rose by 5.0%, reflecting improved factory inputs. Capital goods growth slowed to 4.4% from 6.8% in July, signaling cautious private investment and weighing on manufacturing expansion. Consumer durables grew moderately by 3.5%, but consumer non-durables contracted by 6.3%, reflecting softness in essential household items demand.
Please refer disclaimer at https://www.plindia.com/disclaimer/
SEBI Registration No. INH000000271


More News

Expert Insight on RBI Slashes Repo Rate by Ritu Kant Ojha, a Dubai-based Real Estate Portfol...