Commodity Weekly Report 16th Nov 2025 by Choice Broking

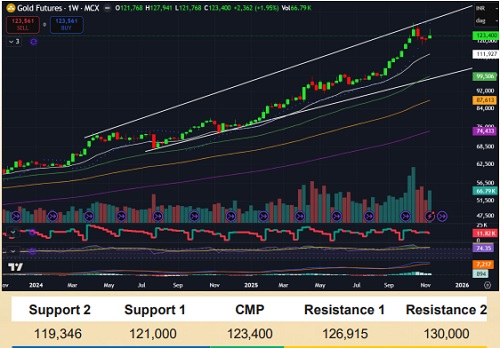
Gold
Following an initial rise the previous week, gold settled lower on Friday in a bumpy trading session, pulled down by a stronger US dollar and risk-averse sentiment. The US dollar is recovering some of its losses as market mood deteriorates, with European share markets falling alongside Wall Street and Asia. Furthermore. hawkish comments from Fed officials have encouraged investors to reduce their expectations of Fed easing in December, providing some support to the US dollar.
MCX Gold December contract has surged marginally towards 127,941 and paused its downside momentum. However, coming towards weekend, we have witnessed a decline of -4.81%, nearly fall of -6000 points from week's peak level and price managed to settle at 123412 On Weekly chart, price has formed a Bullish Hammer candle. Gold price is still trading in Rising channel, trading over its all key moving averages ie. 50, 100 and 200-DEMA levels placed at 118380, 111686 and 102544 respectively, Daily SAR is placed at 119,346. Breakout over week's high will add boost to upward momentum in Gold price and next hurdle would be at 130,685.
The momentum indicator, RSI is trailing over 50 level on Daily chart. On MACD, we can observe a bearish crossover above zero-line along side negative histograms on 4-hourly time-frame
The overall trend in Gold price is expected to be Moderately Bullish in the coming week, and traders should keep an eye on key US economic data such as Flash Manufacturing and Services PMI and Employment data such as Avg. hourly earnings, NFP and Unemployment rate which are scheduled to be releasein next week.
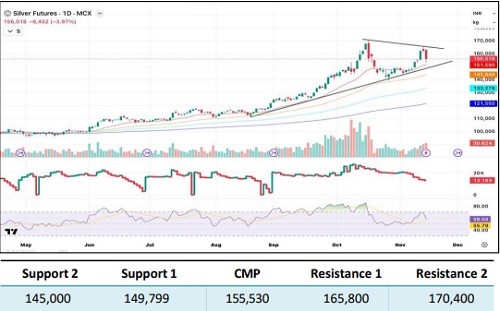
Silver
COMEX Silver extended its gains after a strong weekly rally, rising +12% and registering a three-week high at $5439/ounce. A mid-week round of profit-booking trimmed some of the upside, yet prices managed to close the week at $50.58, holding firmly above key moving averages The broader structure continues to remain constructive, with immediate support seen between $49.60-$45.55. Despite intraday volatility, the weekly momentum profile stays positive, indicating that buyers are likely to defend lower levels, and the trend is expected to remain firmon dips.
MCX Silver surged sharply during the week, posting gains of +16,000 points and marking a high of 165,810 before encountering a sharp mid-week decline of nearly -7% during Thursday and Friday sessions This corrective move has initiated the early formation of a potential double-top pattern, which calls for cautious positioning if prices fail to reclaim the upper range. The December contract, however, closed the week at 156,018, comfortably above the 20-50-100-200 DEMA levels placed at 151,590, 143,850, 133280 and 121550 respectively, reflecting sustained underlying strength. Open Interest (OI) declined by -7,000 lots over the week, indicating long unwinding and short-term profit booking rather than aggressive fresh shorts Daily indicators reveal continued positive momentum, the RSI stands at 58.04 after cooling from overbought territory, while MACD remains in positive crossover despite a reduction in histogram bars, signaling steady bullish undertones.
The Gold-Silver Ratio (Mint Ratio) declined by -6.1% over the week, marking a low at 77.67 and continuing to trade above immediate support zones at 76.90-75.62. The ongoing weakness in the ratio highlights silver's relative outperformance versus gold and reinforces the broader bullish sentiment in silver.
Overall, Silver maintains a positive outlook with prices holding near crucial support zones, suggesting that dips may continue to attract buying interest. Traders should look for buy-on-dips opportunities while closely monitoring volatility and momentum indicators to ensure sustained strength within the prevailing trend structure
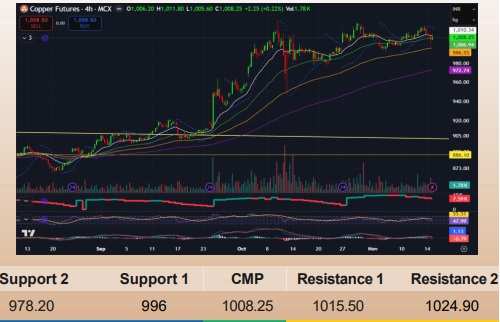
Copper
Recent headwinds for the Copper price include weak Chinese economic data and the partial resumption of operations at Indonesia's Grasberg mine. While China's industrial production and metal output grew year-over-year, the momentum has slowed. Crucially, this slowdown is compounded by weak domestic demand, particularly a renewed downturn in the real estate sector. The resulting combination of robust Chinese production and soft domestic demand is prompting increased exports Industry sources report that China's Copper exports likely exceeded 100,000 tons in October, pushing total 2024 exports toward a record high. High LME Copper prices are also encouraging this export surge. Although current LME inventories show only a slight recent increase in Chinese supply, a continuation of this rising trend would likely support a further downward correction in the Copper.
MCX Copper November contract has traded back & forth over the course of the week, managed to settle on a positive note at 100825. On Weekly chart, price has formed a Bullish Spinning top candle formation as price has taken a correction from the peak of 1020.70, however price has stabled over 20-DEMA level placed at 100135. Key support would be at Daily SAR level placed at 97820. On the other hand, 1024.90 would be a crucial resistance level to look for. Breakout of these levels will be deciding factor for the further course of price action in Copper.
Looking at Ol levels, we can observe a significant drop to 7590 lots with recent price-correction which eliminates any bullish trend continuation in Copper price RSI levels are hovering over 55 levels on Daily as well as Weekly chart. Also, we can observe a bearish crossover on MACD above zero-line along side emergenceof negative histograms on 4-hourly chart.
We are expecting Sideways to Bearish trend in next week in Copper and traders may look for Sell on-rise opportunity.
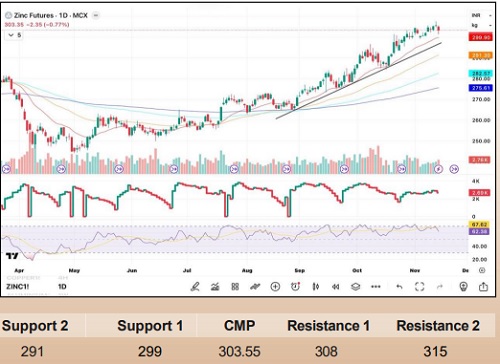
Zinc
Zinc futures registered an upward move of +19% over the week, marking a high of 307.70 and closing the week at 30335, comfortably above key moving averages, including the 20-DEMA aligned near 299. Zinc maintaining stability despite intermittent pullbacks The ongoing respect of the rising trendline suggests that buyers remain active on declines, reinforcing the strategy of accumulating on dips as long as key support levels remain intact Immediate support is placed at 299-291 while resistance is identified at 308-315, where selling pressure or profit booking could emerge if prices approach the upper band of the range
From an indicator perspective, the RSI is currently positioned at 6762, highlighting strong bullish momentum while nearing overbought territory. This indicates sustained strength but also signals the potential for short-term consolidation. The MACD histogram remains in positive territory, with the MACD line holding above the signal line, confirming ongoing upside momentum. Additionally, major moving averages including the 20, 50, 100, and 200 DEMA placed at 299. 291 28250 and 275.60 respectively and continue their bullish alignment below current price levels
Overall the outlook remains sideways to bullish, and the market structure favors a buy-on-dips approach until support levels are decisively broken Traders may look to accumulate near support zones
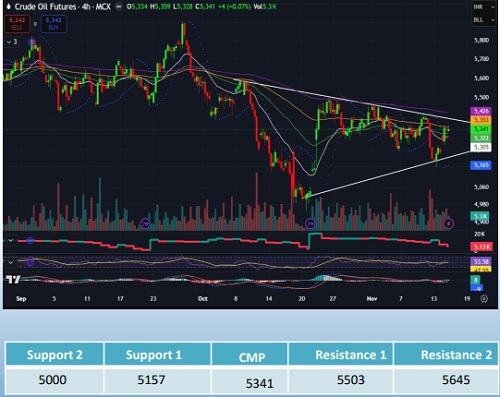
Crude oil
Crude oil prices traded cautiously this week, with negative fundamentals outweighing short-term risk factors. While geopolitical tensions and the end of the US government shutdown provided some brief comfort, the market remained focused on rising global stockpiles, shifting supply-demand projections from OPEC and the IEA, and the widespread belief that supply continues to outstrip demand The most immediate bearish catalyst came from U.S. stockpile data. The Energy Information Administration (EIA) reported a massive 6.4 million barrel build in domestic crude inventories for the week ending November 7, far exceeding analyst expectations of a 196 million barrel increase. The American Petroleum Institute (API) had earlier flagged a 1.3 million barrel build, but the EIA's number confirmed growing concerns about a supply glut
Crude oil price has been traded back & forthover the course of the week, rebounded marginally from the support of 5157 towards weekend and closed on a positive note at 5344. Crude oil price has corrected marginally from 5424 level in the mid-week On Weekly chart, price has formed a Bullish spinning top candle which signifies a indecision among the traders towards expiry. Here, price is trading with in Symmetric triangle formation and stabled over 20-DEMA level placed at 5328. Key resistance would be at 50 and 100-DEMA levels placed at 5408 and 5503 respectively. The momentum indicator, RSI is trailing with in range of 45-55 in 4-hourly. Daily as well as Weekly chart.
Overall the trend in crude oil remains Sideways towards expiry and Crude oil price may trade in the broad range of 5150-5350
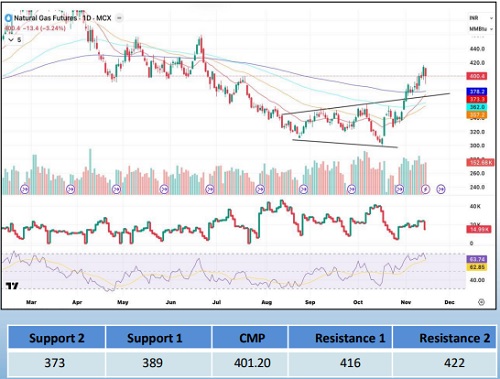
Natural Gas
NYMEX Natural Gas prices witnessed a strong surge of +10% during the week, marking a high at $4.81 and settling at $4.63. The rally was supported by robust global demand and changing weather patterns, fueling a short-term bullish move, Immediate support zones for NYMEX are placed at $4.20-$3.67, while resistance is seen near $492-55.30. Further strength above the resistance could signal a continuation of the present bullish trend
MCX Natural Gas extended its bullish momentum for the fourth consecutive week, making a high at 4163 before closing at 4005. The November contract trades firmly above all major moving averages, with the 20, 50, 100, and 200 DEMA at 378, 373, 362, and 357, respectively. This positioning confirms strong upside momentum and trend reliability in the near term. Support for MCX Natural Gas is situated at 389-373 (coinciding with moving averages and prior breakout zones), whereas resistance is anticipated at the 416-422 zone recent highs that may cap immediate gains if buying momentum fades
Open Interest (OI) declined by 9,000 lots on Friday, suggesting some profit-taking and reduction in speculative positions as prices approached key resistance, Technical indicators remain positive RSI has shifted above 60 (currently 63.74), but is nearing the overbought threshold, urging caution around the 416-422 resistance band Volumes have remained elevated, supporting bullish sentiment
Overall Natural Gas maintains a moderately bullish outlook, with traders advised to follow a buy-on-dips approach into established support while closely watching price behavior near the upper resistance band. Caution is warranted at these elevated levels given the open interest decline and overbought signals from RSL
For Detailed Report With Disclaimer Visit. https://choicebroking.in/disclaimer
SEBI Registration no.: INZ 000160131