Chana Report As On 24th Nov 2025 by Kedia Advisory

Supply Tightness Amid Import Pressure: Despite imports rising over 800% YoY, private stock depletion and reduced arrivals have tightened supply, supporting prices.
Production and Demand Outlook: Chana production for 2024-25 stands at 113.37 lakh tonnes, but remains 5.3% below the five-year average, while annual demand estimates near 7.3 lakh tonnes provide strong support.
MSP vs Market Price Gap: Current prices remain below MSP of ?5650/quintal, indicating limited downside risk and potential for government intervention.
Global & Policy Risks: Yellow pea duty-free import till March 2026 and Australia's 2-2.5 million tonnes output pose risks to price stability.
Technical Support Emerging: RSI recovery, MACD bullish crossover, and Vortex indicator strength suggest trend reversal and potential price rebound toward Rs 6100 by August
Price Performance: Chana prices surged over 10% in one month to ?6,200, driven by tight supply, rising demand, and strong exports.
Supply vs Demand Dynamics: March–July 2025 arrivals surged 37.75% YoY to 17.12 LMT. Chana output at 113.37 LMT, only 5.30% below 5-year average. Demand shifts toward tur, moong may limit price strength.
Import & Policy Risk: May 2025 imports rose 32% MoM to 18,944 tonnes; FY25 imports jumped 800% to 16.13 LMT. Duty-free yellow pea import extension till March 2026 pressures domestic chana price outlook.
Seasonal Factors & Export Boost: Apr–May 2025 exports up 41% YoY at 55,708 tonnes; FY25 exports rose 86% to 1.15 LMT. Better July monsoon could improve Rabi crop, capping festive season price gains.
Bearish Pattern Signals Reversal Risk: A Bearish Harmonic Pattern has emerged near Rs 6275, indicating trend exhaustion. Prices have faced resistance at the pattern completion zone with signs of correction ahead.
Technical Indicators Turning Cautious: RSI has dropped from 76.54, exiting the overbought zone. MACD remains elevated but may converge. Vortex shows early weakness, and the Choppiness Index at 14.91 confirms high volatility with a risk of trend reversal.
Price Performance: Chana slipped over 4% in July–Aug 2025 to near ?6,000, after a bearish harmonic pattern triggered reversal pressure around ?6,300–6,400.
Supply–Demand Balance: Arrivals rose 35.85% YoY to 18.15 LMT, while private stocks fell 70–75%, but substitution into tur, moong and urad capped upside.
Imports & Policy Risks: Duty-free yellow pea import extension till March 2026, coupled with FY25 imports jumping 800% to 16.13 LMT, continued to pressure chana prices.
Exports & Festive Support: Apr–Jun 2025 exports rose 124% to 25.7 LMT. Festive demand may aid sentiment, though global easing in pulses and NAFED release remain threats.
Technicals: RSI weakening at 49.10, MACD neutral, Vortex shows bullish exhaustion. Prices below 200 MA with an Head & Shoulders neckline risk further downside.
Price Performance: Chana prices dropped over 4% in September to around ?5,700, extending the bearish trend flagged in earlier updates. Despite festive demand expectations, weakness persists as arrivals surged 34.3% YoY (19.13 LMT from Mar–Sep 2025) and inflation for gram eased –9.1% YoY in August, underscoring pressure on prices.
Supply–Demand Balance: Production for 2024–25 is projected at 113.37 LMT, up 2.7% YoY and above recent averages, while procurement fell only modestly to 23.53 LMT. Canadian chickpea carryover stocks (double last year) and fresh supply from Russia/Canada (Oct–Nov), further dilute domestic price strength.
Macro & Policy Drivers: Shifts in consumption toward cheaper pulses (tur, moong, urad) weigh on Chana’s demand. Global pulse prices are easing, creating export competition for India.
Technical Indicators: RSI at 38.58 continues to weaken, confirming downside momentum. Spot prices remain below the 100 MA with the 50 MA acting as resistance. MACD is below zero with a bearish crossover looming, while the Vortex indicator shows bullish momentum exhaustion. Together, technicals reinforce the negative bias.
Price Performance: Price Performance: Chana prices dropped nearly 2% during September, extending the bearish tone highlighted in earlier reports. Despite festive season expectations, the market stayed weak as India’s chana imports surged 869.5% YoY to 11.77 LMT and inflation for gram fell 13.55% YoY, signaling oversupply pressure.
Supply–Demand Balance: Chana production for 2024–25 is projected at 113.37 LMT, up 2.7% from last year, while arrivals rose 8.87% YoY to 20 LMT. However, procurement at 23.53 LMT remains limited, and Canada’s carryover stocks are double last year, indicating ample global availability that dampens domestic price momentum.
Macro & Policy Drivers: The extension of duty-free yellow pea imports until March 2026 and weak global pulse prices have reduced India’s export competitiveness. Shift in consumption toward cheaper pulses like tur, moong and urad adds further demand-side pressure on Chana, keeping market sentiment bearish.
Technical Indicators: RSI continues to weaken below neutral levels, confirming downside momentum. Spot prices are trading under key moving averages, while MACD signals bearish crossover and Vortex indicates bullish exhaustion. Together, these patterns reinforce a continuing negative bias for near-term price action.
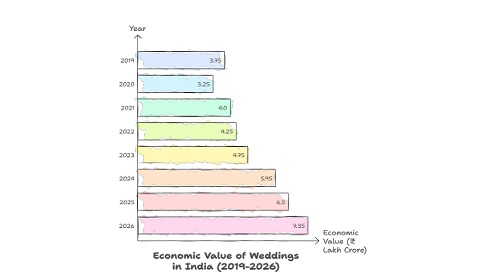
India’s 10–14 million annual weddings create a sharp seasonal surge in pulses demand, especially during November–February. Multi-day wedding menus require large quantities of jeera, turmeric, chilli, garam masala, and regional blends, prompting caterers to stock 30–40% extra. Rising incomes and richer cuisines also boost demand for premium, organic, and ready-to-use spice mixes.
* Weddings create major seasonal spikes in pulses procurement across India.
* Caterers stock more pulses during peak marriage months.
* Multi-day menus drive high use of pulses
* Rising incomes boost demand for premium pulses varieties.
* Regional wedding cuisines increase consumption of specialized pulses.
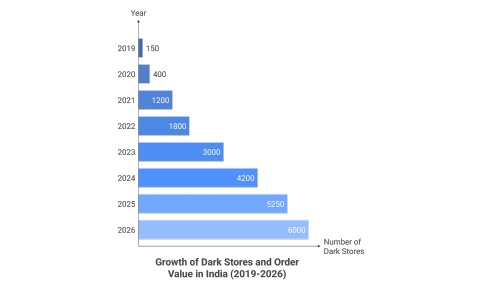
The rapid rise of dark stores—from under 150 in 2019 to over 4,000 in 2024—has significantly boosted FMCG and pulses demand in India. Quick commerce players like Blinkit, Zepto, and Instamart now rely on dark stores to push high-frequency categories such as packaged foods, snacks, oils, and pulses. Faster delivery cycles have increased consumption of masalas, ready-to-cook mixes, and pulses. With 6,000+ dark stores expected by 2026, FMCG penetration and branded spice sales will accelerate further.
* Dark stores drive higher demand for FMCG and daily-use essentials.
* Instant delivery boosts sales of pulses.
* Quick commerce increases frequency of grocery and pulses purchases.
* Expansion to 6,000+ dark stores by 2026 strengthens FMCG distribution.
Looking at the Daily Chart, USDINR has been moving steadily higher after completing a rounding bottom pattern, and the price recently jumped toward the 89.16 area, showing strong bullish momentum. In my view, the trend still appears positive as long as the pair holds above key support zones, and volatility has picked up slightly, which traders should be aware of.
If we examine the overall structure, the rounding bottom that developed through early and mid-2025 has played out well, with price breaking above the neckline and stretching toward the 127.20 percent Fibonacci extension at 89.12. The immediate support is near 87.98, followed by a deeper level around 86.36. The 50-day and 200-day moving averages at 87.00 and 86.83 respectively are still sloping upward, which generally supports the broader uptrend.
RSI is hovering around 60.73, staying above the 50 mark, which usually suggests buyers are still in control, although repeated bearish divergence signals earlier indicate some caution. The MACD has given a bullish crossover, and the histogram is ticking higher, which typically hints at positive momentum building up. Volatility readings have been uneven recently, indicating the market may continue to see wider daily swings.
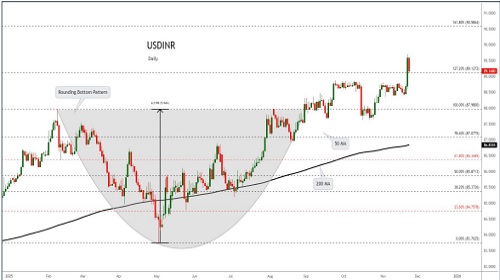
Prices looks to get resistance at 89.80 and support at 88.20
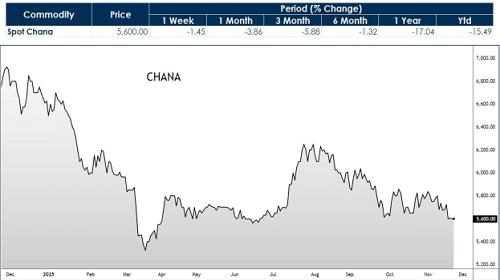
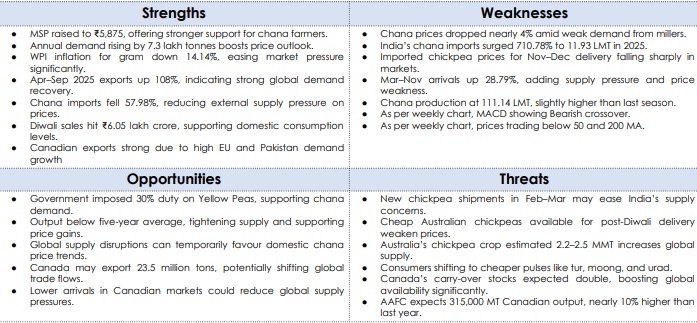
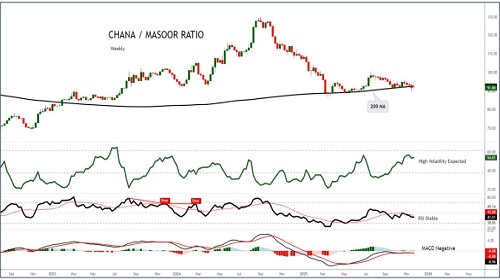
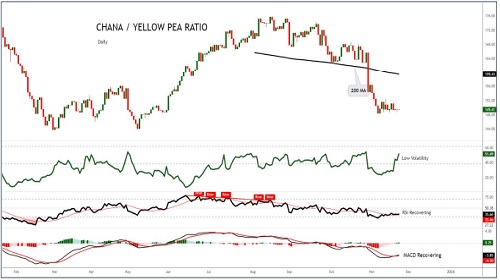
Price Performance: Chana prices have remained under pressure through 2025, with spot rates slipping amid weak miller demand and higher arrivals. However, the steep correction appears to be stabilizing, and rising festive consumption along with reduced imports suggests early signs of recovery.
Supply–Demand Balance: Chana production stands at 111.14 LMT, slightly higher than last year, while arrivals rose 28.79%, adding supply pressure. Despite this, imports have dropped 57.98%, and MSP at ?5,875/quintal continues to provide a strong floor. Export demand has improved sharply (108% YoY rise), supporting medium-term recovery potential.
Macro & Policy Drivers: The 30% duty on yellow peas continues to support chana demand by restricting cheaper alternatives. Consumption trends remain favorable, backed by strong festive spending and a shift toward domestic pulses. Global supply disruptions and lower Canadian arrivals could further improve price sentiment in coming months.
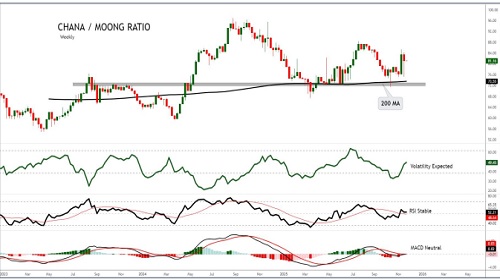
Technical Indicators: RSI is stabilizing near lower levels. MACD shows weakening bearish momentum, while Vortex suggests bearish strength fading